## [Diagram Type]: Directed Graph Panels Illustrating Security Attack and Mitigation Flows
### Overview
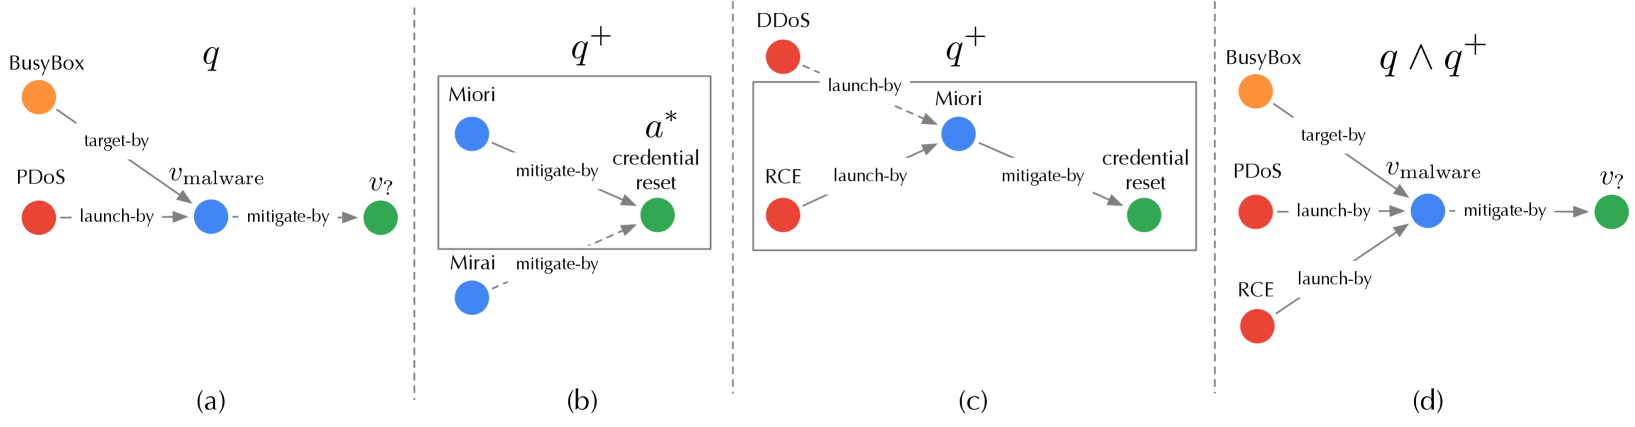
The image displays four distinct directed graph panels, labeled (a), (b), (c), and (d), arranged horizontally. Each panel models relationships between entities (represented as colored nodes) using labeled, directed edges. The diagrams appear to represent a formal or conceptual model of cybersecurity threats, vulnerabilities, and mitigations. The mathematical notations \( q \), \( q^+ \), and \( q \land q^+ \) above the panels suggest different logical states or scenarios within this model.
### Components/Axes
* **Panel Structure:** Four panels separated by vertical dashed lines.
* **Node Types (Color-Coded):**
* **Orange:** Represents a specific software or system (e.g., "BusyBox").
* **Red:** Represents attack types or threat actions (e.g., "PDoS", "DDoS", "RCE").
* **Blue:** Represents malware, botnets, or malicious entities (e.g., "v_malware", "Miori", "Mirai").
* **Green:** Represents vulnerabilities, targets, or mitigation actions (e.g., "v_?", "credential reset").
* **Edge Labels (Relationships):**
* `target-by`: Indicates a targeting relationship.
* `launch-by`: Indicates an attack initiation relationship.
* `mitigate-by`: Indicates a mitigation or countermeasure relationship.
* **Mathematical Notations:**
* Panel (a): Labeled with \( q \).
* Panels (b) and (c): Labeled with \( q^+ \).
* Panel (d): Labeled with \( q \land q^+ \).
* **Spatial Layout:**
* Nodes are positioned to show flow, generally from left (attacks/sources) to right (targets/mitigations).
* Panel (b) contains a rectangular box enclosing two nodes ("Miori" and "credential reset"), with the notation \( a^* \) placed near the "credential reset" node.
### Detailed Analysis / Content Details
**Panel (a) - Scenario \( q \):**
* **Nodes:** "BusyBox" (orange, top-left), "PDoS" (red, bottom-left), "v_malware" (blue, center), "v_?" (green, right).
* **Edges & Flow:**
1. "BusyBox" → `target-by` → "v_malware"
2. "PDoS" → `launch-by` → "v_malware"
3. "v_malware" → `mitigate-by` → "v_?"
* **Interpretation:** This models a scenario where a PDoS attack launches malware (`v_malware`), which targets BusyBox. The malware itself is then mitigated by an unknown action or vulnerability (`v_?`).
**Panel (b) - Scenario \( q^+ \) (Variant 1):**
* **Nodes:** "Miori" (blue, inside box, left), "credential reset" (green, inside box, right), "Mirai" (blue, outside box, bottom-left).
* **Edges & Flow:**
1. "Miori" → `mitigate-by` → "credential reset"
2. "Mirai" → `mitigate-by` → "credential reset" (dashed line)
* **Notation:** \( a^* \) is placed above the "credential reset" node.
* **Interpretation:** This focuses on mitigation. Both the "Miori" and "Mirai" botnets can mitigate a "credential reset" action. The box and \( a^* \) may denote a specific subsystem or a repeated/alternative mitigation path.
**Panel (c) - Scenario \( q^+ \) (Variant 2):**
* **Nodes:** "DDoS" (red, top-left), "RCE" (red, bottom-left), "Miori" (blue, center), "credential reset" (green, right).
* **Edges & Flow:**
1. "DDoS" → `launch-by` → "Miori"
2. "RCE" → `launch-by` → "Miori"
3. "Miori" → `mitigate-by` → "credential reset"
* **Interpretation:** This models a different attack chain. DDoS and RCE (Remote Code Execution) attacks are used to launch the "Miori" entity, which in turn mitigates a "credential reset."
**Panel (d) - Combined Scenario \( q \land q^+ \):**
* **Nodes:** "BusyBox" (orange, top-left), "PDoS" (red, middle-left), "RCE" (red, bottom-left), "v_malware" (blue, center), "v_?" (green, right).
* **Edges & Flow:**
1. "BusyBox" → `target-by` → "v_malware"
2. "PDoS" → `launch-by` → "v_malware"
3. "RCE" → `launch-by` → "v_malware"
4. "v_malware" → `mitigate-by` → "v_?"
* **Interpretation:** This panel synthesizes elements from (a) and (c). It shows a more complex threat landscape where multiple attack types (PDoS and RCE) can launch the same malware (`v_malware`), which targets BusyBox and is mitigated by `v_?`.
### Key Observations
1. **Consistent Color Semantics:** Node colors consistently denote entity types across all panels (Orange=System, Red=Attack, Blue=Malware/Botnet, Green=Mitigation/Target).
2. **Flow Direction:** The general flow is from left (initiating attacks/systems) to right (resulting mitigations/targets).
3. **Evolution of Complexity:** The panels show a progression from a simple attack-mitigation chain in (a), to focused mitigation scenarios in (b) and (c), culminating in a combined, more complex model in (d).
4. **Role of "Miori":** The blue node "Miori" appears in both \( q^+ \) scenarios (b and c), acting as a mitigator in one and a launched entity in the other, suggesting it plays a dual or central role in the \( q^+ \) state.
5. **Formal Notation:** The use of \( q \), \( q^+ \), and logical AND (\( \land \)) indicates this is likely part of a formal methods or logic-based security analysis framework, where \( q^+ \) might represent an extended or alternative state to base state \( q \).
### Interpretation
These diagrams collectively model the relationships between cyber-attacks, the malware they deploy, the systems they target, and the mitigations that counter them. The progression from (a) to (d) suggests an analytical process:
* **Panel (a)** establishes a baseline threat model (\( q \)).
* **Panels (b) and (c)** explore specific, extended scenarios or capabilities (\( q^+ \)) related to mitigation and attack launching.
* **Panel (d)** represents a conjunction (\( \land \)), merging the baseline model with the extended capabilities to analyze a more comprehensive and realistic threat landscape.
The model highlights how different attack vectors (PDoS, RCE, DDoS) can converge on common malware (`v_malware`) or botnets (`Miori`), and how mitigations (like `credential reset` or the unknown `v_?`) are applied at different points in the kill chain. The presence of the unknown `v_?` indicates an area for further investigation or a variable within the formal model. This type of diagram is crucial for threat modeling, security protocol verification, and understanding complex attack-defense dynamics in a structured, visual format.