# Technical Document Extraction: Accuracy vs Base Value Graph
## Chart Description
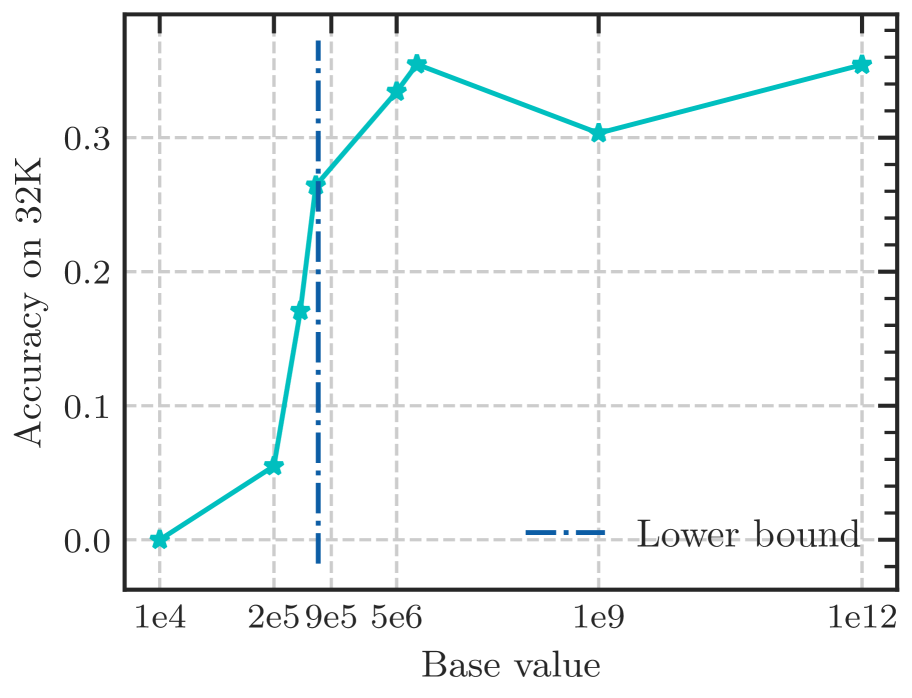
The image depicts a line graph illustrating the relationship between "Base value" (x-axis) and "Accuracy on 32K" (y-axis). The graph includes a primary data series and a reference line labeled "Lower bound."
---
### **Axes and Labels**
- **Y-axis**:
- Title: "Accuracy on 32K"
- Scale: 0.0 to 0.3 in increments of 0.1
- Tick marks: Dashed horizontal lines at each increment
- **X-axis**:
- Title: "Base value"
- Scale: Logarithmic (1e4 to 1e12)
- Key markers:
- 2e5 (2×10⁵)
- 9e5 (9×10⁵)
- 5e6 (5×10⁶)
- 1e9 (1×10⁹)
- 1e12 (1×10¹²)
- Tick marks: Dashed vertical lines at each marker
---
### **Legend**
- **Location**: Lower-right corner of the chart
- **Entries**:
1. **Cyan line with star markers**: "Accuracy on 32K"
2. **Blue dashed vertical line**: "Lower bound"
---
### **Data Series and Trends**
#### **Primary Series (Cyan Line with Star Markers)**
- **Trend**:
- Starts at **0.0** when Base value = 1e4
- Sharp increase to **0.15** at 2e5
- Continues rising to **0.25** at 9e5
- Peaks at **0.35** at 5e6
- Dips to **0.30** at 1e9
- Rises again to **0.35** at 1e12
- **Key Data Points**:
| Base Value | Accuracy on 32K |
|------------|-----------------|
| 1e4 | 0.0 |
| 2e5 | 0.15 |
| 9e5 | 0.25 |
| 5e6 | 0.35 |
| 1e9 | 0.30 |
| 1e12 | 0.35 |
#### **Reference Line (Blue Dashed Vertical Line)**
- **Label**: "Lower bound"
- **Position**: Fixed at **Base value = 9e5** (9×10⁵)
- **Purpose**: Indicates a threshold or minimum acceptable value for the primary series.
---
### **Chart Components**
1. **Grid**:
- Dashed horizontal and vertical lines for alignment.
2. **Markers**:
- Star symbols denote data points for the primary series.
3. **Annotations**:
- "Lower bound" explicitly labeled on the blue dashed line.
---
### **Observations**
- The primary series exhibits a **non-linear relationship** between Base value and Accuracy on 32K, with a notable peak at 5e6 and a dip at 1e9.
- The "Lower bound" at 9e5 acts as a critical threshold, with the primary series crossing it at 9e5 and maintaining higher values beyond.
- Accuracy stabilizes at **0.35** for Base values ≥5e6, except for a temporary drop at 1e9.
---
### **Missing Elements**
- No chart title is present in the image.
- No additional annotations or contextual text beyond axis labels and legend.
---
### **Conclusion**
The graph demonstrates that Accuracy on 32K improves significantly with increasing Base value up to 5e6, after which it fluctuates but remains above the "Lower bound" threshold. The dip at 1e9 suggests potential instability or optimization challenges at that scale.