## Line Chart: Accuracy vs. Time for Different Parameters
### Overview
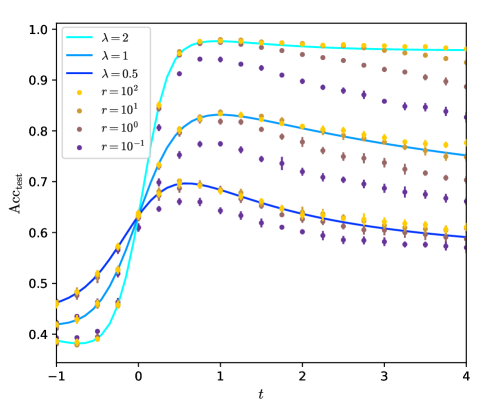
The image is a line chart displaying the test accuracy (Acc_test) of a model over time (t) for different values of parameters lambda (λ) and r. The chart shows how the accuracy changes as time progresses for each parameter setting. The x-axis represents time (t), and the y-axis represents the test accuracy (Acc_test). There are six data series plotted, distinguished by color and corresponding to different values of λ and r.
### Components/Axes
* **X-axis:**
* Label: t
* Scale: -1 to 4, with integer markers at -1, 0, 1, 2, 3, and 4.
* **Y-axis:**
* Label: Acc_test
* Scale: 0.4 to 1.0, with markers at 0.4, 0.5, 0.6, 0.7, 0.8, 0.9, and 1.0.
* **Legend (Top-Left):**
* Cyan: λ = 2
* Light Blue: λ = 1
* Dark Blue: λ = 0.5
* Yellow: r = 10^2
* Tan: r = 10^1
* Gray: r = 10^0
* Purple: r = 10^-1
### Detailed Analysis
* **λ = 2 (Cyan):** The line starts at approximately 0.38 at t = -1, rises sharply to approximately 0.97 at t = 1, and then remains relatively constant around 0.97-0.98 for t > 1.
* **λ = 1 (Light Blue):** The line starts at approximately 0.42 at t = -1, rises sharply to approximately 0.83 at t = 1, and then remains relatively constant around 0.83 for t > 1.
* **λ = 0.5 (Dark Blue):** The line starts at approximately 0.45 at t = -1, rises sharply to approximately 0.69 at t = 1, and then decreases slightly to approximately 0.6 at t = 4.
* **r = 10^2 (Yellow):** The data points start at approximately 0.4 at t = -1, rises sharply to approximately 0.92 at t = 1, and then decreases slightly to approximately 0.8 at t = 4.
* **r = 10^1 (Tan):** The data points start at approximately 0.4 at t = -1, rises sharply to approximately 0.8 at t = 1, and then decreases slightly to approximately 0.75 at t = 4.
* **r = 10^0 (Gray):** The data points start at approximately 0.4 at t = -1, rises sharply to approximately 0.7 at t = 1, and then decreases slightly to approximately 0.65 at t = 4.
* **r = 10^-1 (Purple):** The data points start at approximately 0.4 at t = -1, rises sharply to approximately 0.65 at t = 1, and then decreases slightly to approximately 0.6 at t = 4.
### Key Observations
* The accuracy increases rapidly between t = -1 and t = 1 for all parameter settings.
* For λ values, higher values of λ result in higher test accuracy.
* For r values, higher values of r result in higher test accuracy.
* The accuracy tends to stabilize or slightly decrease after t = 1 for most parameter settings.
* The lines for λ = 2 and λ = 1 are smooth, while the data for r values are represented by discrete points with error bars.
### Interpretation
The chart demonstrates the impact of parameters λ and r on the test accuracy of a model over time. Higher values of both λ and r generally lead to better performance, as indicated by the higher accuracy achieved. The rapid increase in accuracy between t = -1 and t = 1 suggests a critical learning phase for the model. The stabilization or slight decrease in accuracy after t = 1 could indicate overfitting or diminishing returns from further training. The error bars on the r values suggest that the model's performance is more variable for these parameter settings compared to the λ values.