\n
## Line Chart: Test Accuracy vs. Time
### Overview
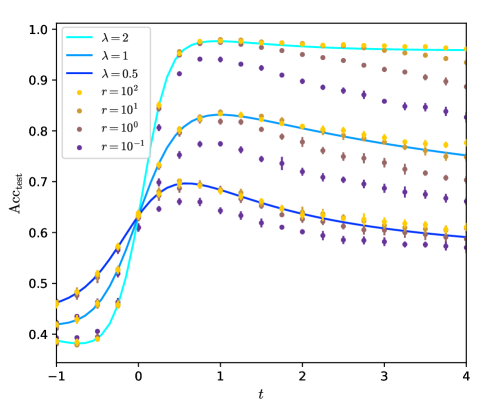
The image presents a line chart illustrating the relationship between test accuracy (Acc_test) and time (t) for different values of lambda (λ) and r. The chart displays multiple lines, each representing a unique combination of λ and r, showing how test accuracy changes over time.
### Components/Axes
* **X-axis:** Labeled as 't', representing time. The scale ranges from approximately -1 to 4.
* **Y-axis:** Labeled as 'Acc_test', representing test accuracy. The scale ranges from approximately 0.4 to 1.0.
* **Legend:** Located in the top-left corner, providing labels for each line:
* λ = 2 (Cyan)
* λ = 1 (Blue)
* λ = 0.5 (Dark Blue)
* r = 10<sup>2</sup> (Yellow)
* r = 10<sup>1</sup> (Orange)
* r = 10<sup>0</sup> (Purple)
### Detailed Analysis
The chart contains six distinct lines, each representing a different parameter setting.
* **λ = 2 (Cyan):** This line exhibits a rapid increase in Acc_test from approximately 0.4 at t = -1 to nearly 1.0 at t = 1. It plateaus around 0.98-1.0 for t > 1.
* **λ = 1 (Blue):** This line shows a slower increase in Acc_test compared to λ = 2, starting at approximately 0.4 at t = -1 and reaching around 0.8 at t = 1. It then plateaus around 0.82-0.85 for t > 1.
* **λ = 0.5 (Dark Blue):** This line demonstrates the slowest increase in Acc_test among the λ series, starting at approximately 0.4 at t = -1 and reaching around 0.65 at t = 1. It plateaus around 0.58-0.62 for t > 1.
* **r = 10<sup>2</sup> (Yellow):** This line starts at approximately 0.4 at t = -1, increases to around 0.85 at t = 1, and then gradually decreases to approximately 0.78 at t = 4.
* **r = 10<sup>1</sup> (Orange):** This line begins at approximately 0.4 at t = -1, increases to around 0.8 at t = 1, and then gradually decreases to approximately 0.72 at t = 4.
* **r = 10<sup>0</sup> (Purple):** This line starts at approximately 0.4 at t = -1, increases to around 0.7 at t = 1, and then gradually decreases to approximately 0.58 at t = 4.
### Key Observations
* Higher values of λ (2 and 1) lead to faster convergence to higher test accuracy.
* The lines for different values of r exhibit an initial increase in accuracy followed by a decrease, suggesting a potential overfitting or instability issue.
* The λ series lines plateau at higher accuracy levels than the r series lines.
* The r = 10<sup>2</sup> line maintains the highest accuracy among the r series throughout the observed time range.
### Interpretation
The chart likely represents the performance of a learning algorithm or model over time, with λ and r being hyperparameters controlling the learning process. The λ parameter appears to influence the learning rate or regularization strength, with higher values leading to faster learning and potentially better generalization (as indicated by the higher plateau accuracy). The r parameter might relate to a different aspect of the model or learning process, such as the complexity or capacity of the model. The decreasing accuracy for the r series suggests that increasing r beyond a certain point can lead to overfitting or instability, causing the model to perform worse on unseen data. The data suggests that a balance between λ and r is crucial for achieving optimal performance. The initial increase in accuracy for all lines indicates that the model is initially learning from the data, but the subsequent behavior depends on the specific parameter settings.