```markdown
# Technical Document Extraction
## Line Graphs (Left Section)
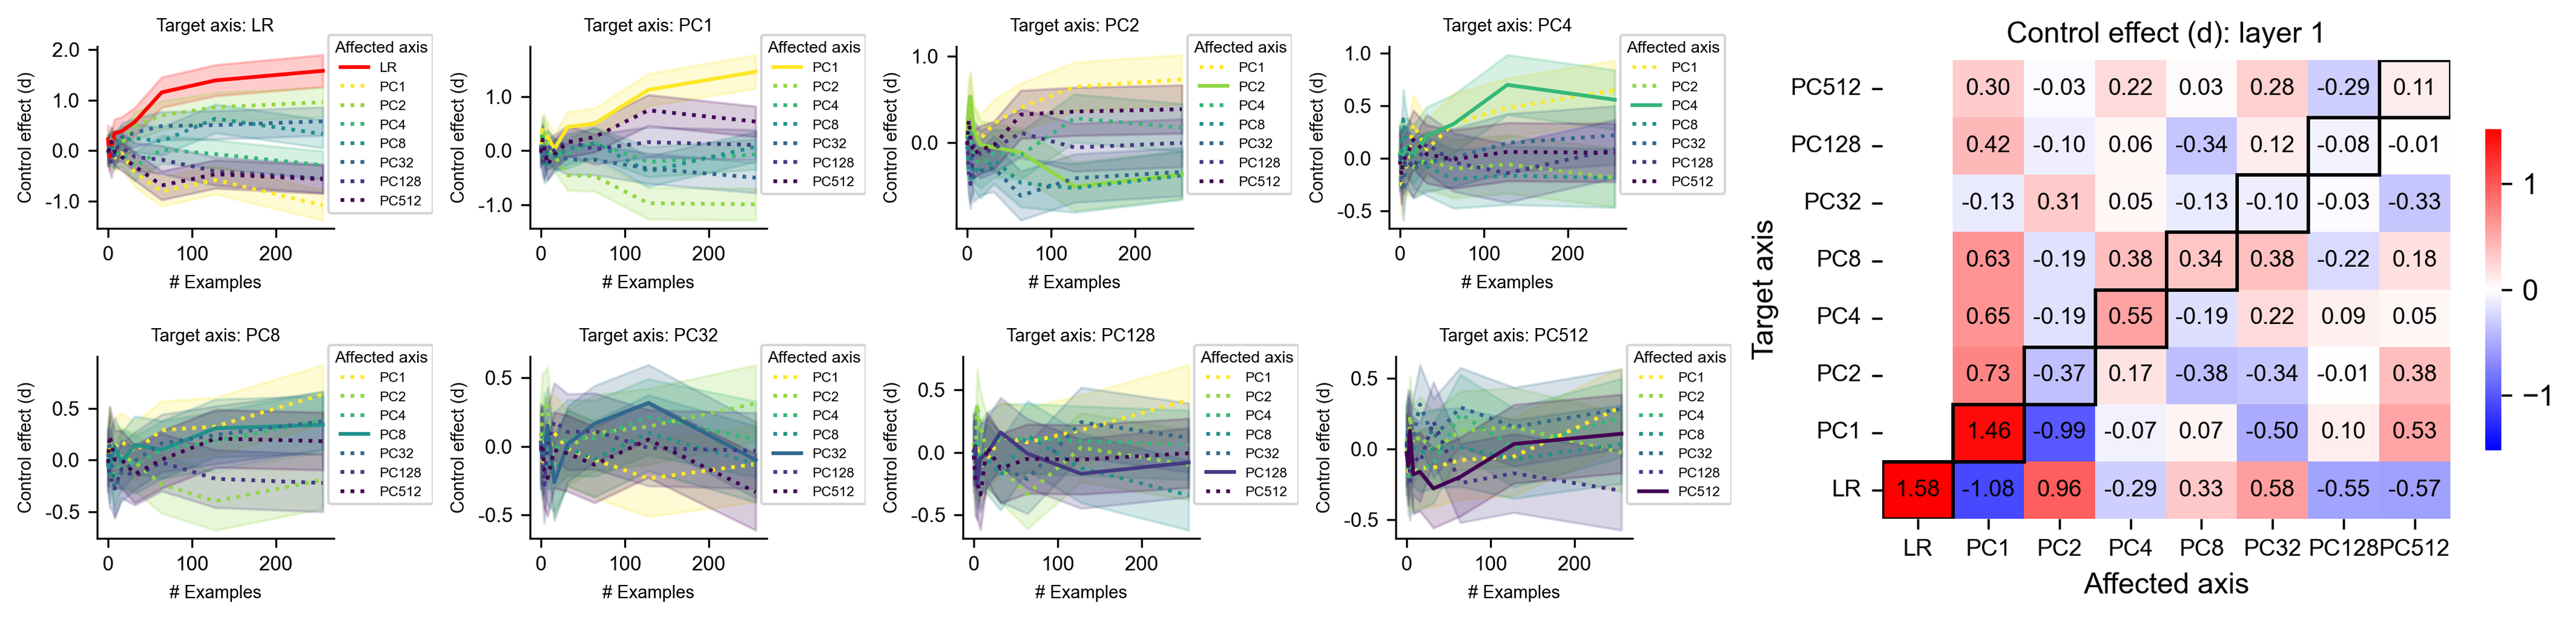
Eight line graphs depict the relationship between **# Examples** (x-axis) and **Control effect (d)** (y-axis) for different **Target axis** and **Affected axis** combinations. Key observations:
### Graph Structure
- **X-axis**: `# Examples` (0–200)
- **Y-axis**: `Control effect (d)` (range: -1.5 to 2.0)
- **Lines**: Color-coded with shaded confidence intervals
- **Legend**:
- `LR` (solid red)
- `PC1` (solid orange)
- `PC2` (solid green)
- `PC4` (solid teal)
- `PC8` (solid dark blue)
- `PC32` (solid purple)
- `PC128` (solid dark purple)
- `PC512` (solid black)
### Graph-Specific Details
1. **Target axis: LR**
- Affected axes: PC1–PC512
- Lines: Red (LR), orange (PC1), green (PC2), teal (PC4), dark blue (PC8), purple (PC32), dark purple (PC128), black (PC512)
- Trend: Control effect increases with examples for most axes; PC128 shows sharp decline after 100 examples.
2. **Target axis: PC1**
- Affected axes: PC1–PC512
- Lines: Orange (PC1), green (PC2), teal (PC4), dark blue (PC8), purple (PC32), dark purple (PC128), black (PC512)
- Trend: PC1 and PC2 dominate early; PC512 stabilizes near 0.
3. **Target axis: PC2**
- Affected axes: PC1–PC512
- Lines: Green (PC2), teal (PC4), dark blue (PC8), purple (PC32), dark purple (PC128), black (PC512)
- Trend: PC2 and PC4 show strong positive correlation; PC128 declines sharply.
4. **Target axis: PC4**
- Affected axes: PC1–PC512
- Lines: Teal (PC4), dark blue (PC8), purple (PC32), dark purple (PC128), black (PC512)
- Trend: PC4 and PC8 align closely; PC128 diverges after 100 examples.
5. **Target axis: PC8**
- Affected axes: PC1–PC512
- Lines: Dark blue (PC8), purple (PC32), dark purple (PC128), black (PC512)
- Trend: PC8 and PC32 overlap; PC128 shows negative divergence.
6. **Target axis: PC32**
- Affected axes: PC1–PC512
- Lines: Purple (PC32), dark purple (PC128), black (PC512)
- Trend: PC32 and PC128 align; PC512 stabilizes near 0.
7. **Target axis: PC128**
- Affected axes: PC1–PC512
- Lines: Dark purple (PC128), black (PC512)
- Trend: PC128 and PC512 show inverse relationship.
8. **Target axis: PC512**
- Affected axes: PC1–PC512
- Lines: Black (PC512)
- Trend: Minimal variation; stabilizes near 0.
## Heatmap (Right Section)
Labeled **"Control effect (d): layer 1"**, the heatmap quantifies relationships between **Target axis** (rows) and **Affected axis** (columns). Color scale: red (positive) to blue (negative), with values from -1 to 1.
### Table Structure
| Target Axis | PC1 | PC2 | PC4 | PC8 | PC32 | PC128 | PC512 |
|-------------|--------|--------|--------|--------|--------|--------|--------|
| **LR** | 0.30 | -0.03 | 0.22 | 0.03 | 0.28 | -0.29 | 0.11 |
| **PC1** | 0.42 | -0.10 | 0.06 | -0.34 | 0.12 | -0.08 | -0.01 |
| **PC2** | -0.13 | 0.31 | 0.05 | -0.13 | -0.10 | -0.03 | -0.33 |
| **PC4** | 0.63 | -0.19 | 0.38 | 0.34 | 0.38 | -0.22 | 0.18 |
| **PC8** | 0.65 | -0.19 | 0.55 | -0.19 | 0.22 | 0.09 | 0.05 |
| **PC32** | 0.73 | -0.37 | 0.17 | -0.38 | -0.34 | -0.01 | 0.38 |
| **PC128** | 1.46 | -0.99 | -0.07 | 0.07 | -0.50 | 0.10 | 0.53 |
| **PC512** | -1.08 | 0.96 | -0.29 | 0.33 | 0.58 | -0.