## Bar Charts: Text Similarity and High Similarity Text Percentage
### Overview
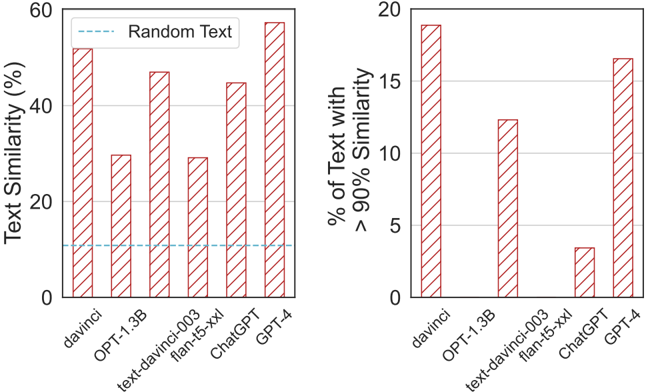
The image contains two bar charts comparing the text similarity and percentage of text with >90% similarity for different language models: davinci, OPT-1.3B, text-davinci-003, flan-t5-xxl, ChatGPT, and GPT-4. The first chart shows the overall text similarity, while the second focuses on the percentage of text exceeding a 90% similarity threshold.
### Components/Axes
**Left Chart:**
* **Title:** Text Similarity (%)
* **Y-axis:** Text Similarity (%), ranging from 0 to 60. Axis markers at 0, 20, 40, and 60.
* **X-axis:** Language models: davinci, OPT-1.3B, text-davinci-003, flan-t5-xxl, ChatGPT, GPT-4.
* **Bars:** Reddish-brown with diagonal hatching.
* **Legend:** A horizontal dashed light blue line labeled "Random Text".
**Right Chart:**
* **Title:** % of Text with > 90% Similarity
* **Y-axis:** % of Text with > 90% Similarity, ranging from 0 to 20. Axis markers at 0, 5, 10, 15, and 20.
* **X-axis:** Language models: davinci, OPT-1.3B, text-davinci-003, flan-t5-xxl, ChatGPT, GPT-4.
* **Bars:** Reddish-brown with diagonal hatching.
### Detailed Analysis
**Left Chart: Text Similarity (%)**
* **davinci:** Approximately 49%.
* **OPT-1.3B:** Approximately 30%.
* **text-davinci-003:** Approximately 40%.
* **flan-t5-xxl:** Approximately 30%.
* **ChatGPT:** Approximately 45%.
* **GPT-4:** Approximately 58%.
* **Random Text:** Approximately 10%.
**Trend:** The text similarity varies across the models. GPT-4 has the highest similarity, followed by davinci. OPT-1.3B and flan-t5-xxl have the lowest similarity.
**Right Chart: % of Text with > 90% Similarity**
* **davinci:** Approximately 19%.
* **OPT-1.3B:** Approximately 12.5%.
* **text-davinci-003:** Approximately 12.5%.
* **flan-t5-xxl:** Approximately 2%.
* **ChatGPT:** Approximately 3%.
* **GPT-4:** Approximately 16.5%.
**Trend:** davinci has the highest percentage of text with >90% similarity, followed by GPT-4. flan-t5-xxl and ChatGPT have the lowest percentages.
### Key Observations
* GPT-4 and davinci consistently show high text similarity in both charts.
* OPT-1.3B and flan-t5-xxl generally have lower text similarity.
* The "Random Text" baseline in the left chart provides a reference point for the similarity scores.
### Interpretation
The charts compare the text similarity performance of different language models. The first chart shows the overall similarity, while the second focuses on high similarity (>90%). The data suggests that GPT-4 and davinci are more consistent in generating similar text compared to the other models. The low percentage of high similarity text for flan-t5-xxl and ChatGPT indicates that these models may produce more diverse or less predictable outputs. The "Random Text" baseline helps to contextualize the similarity scores, showing how the models perform relative to a random comparison.