## Bar Charts: Text Similarity Metrics Across AI Models
### Overview
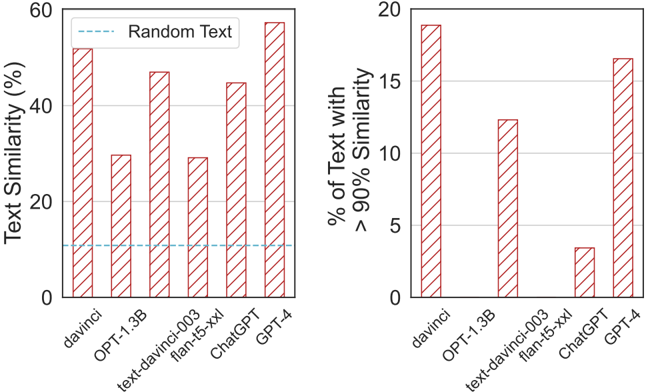
The image displays two side-by-side vertical bar charts comparing various AI language models on text similarity metrics. The charts share the same set of models on the x-axis but measure different aspects of similarity on their respective y-axes. The visual style uses red bars with diagonal white stripes for all data series.
### Components/Axes
**Common Elements:**
* **X-axis (Both Charts):** Lists six AI models. The labels are rotated approximately 45 degrees for readability.
* `davinci`
* `OPT-1.3B`
* `text-davinci-003`
* `flan-t5-xxl`
* `ChatGPT`
* `GPT-4`
* **Bar Style:** All bars are filled with a pattern of red diagonal stripes on a white background.
**Left Chart:**
* **Title/Y-axis Label:** `Text Similarity (%)`
* **Y-axis Scale:** Linear scale from 0 to 60, with major tick marks at 0, 20, 40, and 60.
* **Legend:** Located in the top-left corner. Contains a single entry: a dashed blue line labeled `Random Text`.
* **Additional Element:** A horizontal dashed blue line runs across the chart at approximately the 10% mark, corresponding to the "Random Text" legend.
**Right Chart:**
* **Title/Y-axis Label:** `% of Text with > 90% Similarity`
* **Y-axis Scale:** Linear scale from 0 to 20, with major tick marks at 0, 5, 10, 15, and 20.
* **Legend:** None present.
### Detailed Analysis
**Left Chart - Text Similarity (%):**
This chart measures an overall similarity percentage. The approximate values for each model, estimated from bar height, are:
* `davinci`: ~52%
* `OPT-1.3B`: ~30%
* `text-davinci-003`: ~48%
* `flan-t5-xxl`: ~30%
* `ChatGPT`: ~45%
* `GPT-4`: ~58%
* **Random Text Baseline:** ~10% (dashed blue line).
**Trend Verification:** The bars show significant variation. `GPT-4` and `davinci` have the highest similarity scores, both above 50%. `OPT-1.3B` and `flan-t5-xxl` are the lowest among the models, at approximately 30%. All models score substantially higher than the "Random Text" baseline.
**Right Chart - % of Text with > 90% Similarity:**
This chart measures the proportion of generated text that achieves very high similarity (>90%). The approximate values are:
* `davinci`: ~19%
* `OPT-1.3B`: ~12.5%
* `text-davinci-003`: ~0% (no visible bar)
* `flan-t5-xxl`: ~3.5%
* `ChatGPT`: ~0% (no visible bar)
* `GPT-4`: ~16.5%
**Trend Verification:** The distribution is starkly different from the left chart. `davinci` and `GPT-4` again lead, with nearly 1 in 5 texts showing >90% similarity. `OPT-1.3B` has a moderate value. Notably, `text-davinci-003` and `ChatGPT` show 0% (or a value too small to render a visible bar), indicating they almost never produce text with such high similarity. `flan-t5-xxl` has a very low but non-zero value.
### Key Observations
1. **Model Performance Dichotomy:** `davinci` and `GPT-4` consistently show high similarity on both metrics. In contrast, `text-davinci-003` and `ChatGPT` present a paradox: they have moderate *overall* similarity (left chart, 45-48%) but virtually *zero* instances of very high similarity (right chart, 0%).
2. **Baseline Comparison:** All models perform above the "Random Text" baseline (~10%) for overall similarity, confirming their outputs are non-random with respect to the similarity measure used.
3. **Outliers:** The 0% values for `text-davinci-003` and `ChatGPT` on the right chart are the most significant outliers, suggesting a fundamental difference in how these models generate text compared to `davinci` or `GPT-4` in this specific evaluation context.
### Interpretation
The data suggests an investigation into how closely the output of various language models matches a reference corpus or prompt (the exact source of "similarity" is not specified in the image).
* **What the data demonstrates:** The charts likely aim to measure model "memorization" or propensity to reproduce training data verbatim. High similarity, especially the >90% metric, could indicate a higher risk of regurgitating copyrighted or sensitive information from the training set.
* **Relationship between elements:** The left chart gives a broad view of similarity, while the right chart acts as a filter for extreme cases. The disconnect for `text-davinci-003` and `ChatGPT` is critical: their moderate overall similarity is composed of many low-to-moderate similarity matches, but they avoid near-exact copies. This could be the result of specific fine-tuning, reinforcement learning from human feedback (RLHF), or other safety measures designed to reduce verbatim repetition.
* **Underlying implications:** `GPT-4` and the base `davinci` model appear more likely to produce near-identical text passages. The models in the middle (`OPT-1.3B`, `flan-t5-xxl`) show lower similarity overall. The most striking finding is the apparent success of `text-davinci-003` and `ChatGPT` in eliminating high-similarity outputs while maintaining a moderate level of general similarity, which may reflect a deliberate design choice to balance utility with safety and originality.