# Technical Document: Decision Flowchart for KANs vs. MLPs
## Overview
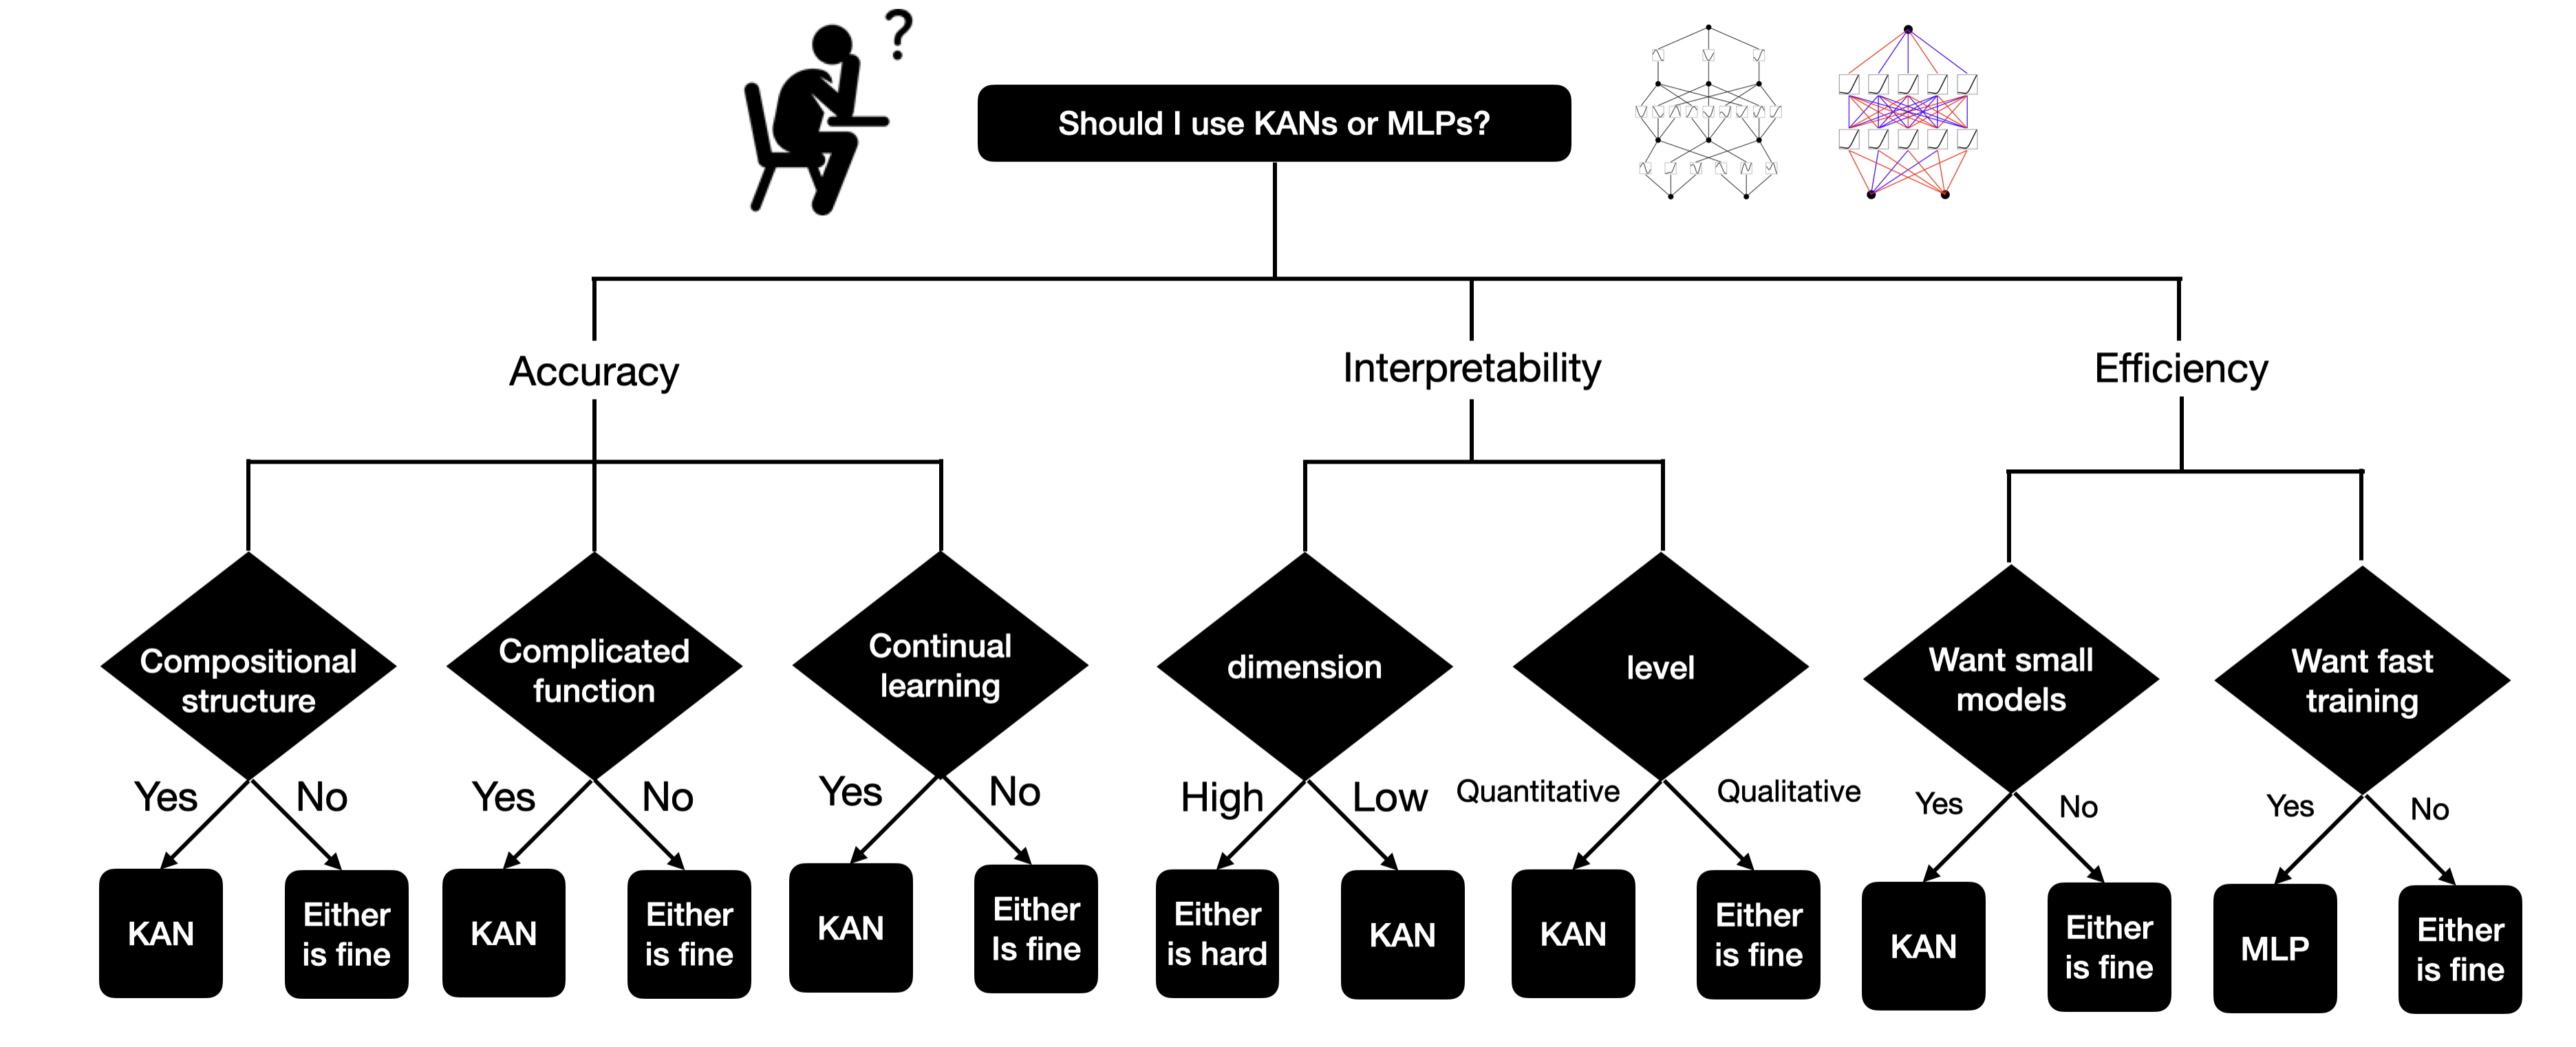
The image presents a decision flowchart titled **"Should I use KANs or MLPs?"** designed to guide users in selecting between Kernel Approximate Neural Networks (KANs) and Multilayer Perceptrons (MLPs) based on three criteria: **Accuracy**, **Interpretability**, and **Efficiency**. The flowchart uses a tree-like structure with binary decision nodes (diamonds) and terminal outcomes (rectangles).
---
## Key Components
### 1. **Main Title**
- **"Should I use KANs or MLPs?"**
- Positioned at the top center, serving as the root question for the flowchart.
### 2. **Primary Criteria**
Three high-level decision branches:
1. **Accuracy**
2. **Interpretability**
3. **Efficiency**
Each branch splits into sub-questions and outcomes.
---
## Detailed Flowchart Analysis
### **Accuracy Branch**
#### Sub-Questions:
1. **Compositional structure**
- **Yes**: KAN
- **No**: Either is fine
2. **Complicated function**
- **Yes**: KAN
- **No**: Either is fine
3. **Continual learning**
- **Yes**: KAN
- **No**: Either is fine
---
### **Interpretability Branch**
#### Sub-Questions:
1. **Dimension**
- **High**: Either is hard
- **Low**: KAN
2. **Level**
- **Quantitative**: KAN
- **Qualitative**: Either is fine
---
### **Efficiency Branch**
#### Sub-Questions:
1. **Want small models**
- **Yes**: KAN
- **No**: Either is fine
2. **Want fast training**
- **Yes**: MLP
- **No**: Either is fine
---
## Terminal Outcomes
The flowchart concludes with three possible outcomes:
1. **KAN** (Kernel Approximate Neural Network)
2. **MLP** (Multilayer Perceptron)
3. **Either is fine** (No strong preference based on criteria)
---
## Visual Elements
- **Neural Network Diagrams**:
- Two schematic diagrams at the top right:
- Left: Likely represents a KAN (structured as a graph with interconnected nodes).
- Right: Likely represents an MLP (structured as a layered network with colored edges).
- No explicit labels for these diagrams in the image.
- **Icons**:
- A seated figure with a question mark (`?`) at the top left, symbolizing decision-making uncertainty.
---
## Key Trends and Data Points
- **KANs** are recommended when:
- The problem involves compositional structure, complicated functions, or continual learning.
- Interpretability requirements are low-dimensional or quantitative.
- Small models or fast training are not prioritized.
- **MLPs** are recommended when:
- Fast training is prioritized.
- Other criteria (accuracy, interpretability) do not strongly favor KANs.
- **Neutral Outcomes**:
- "Either is fine" appears frequently, indicating scenarios where both KANs and MLPs are viable.
---
## Notes
- The flowchart assumes binary decisions at each node (Yes/No).
- No numerical data or statistical trends are present; the flowchart is purely logical.
- The neural network diagrams are illustrative but lack explicit labels for layers or activation functions.
---
## Conclusion
This flowchart provides a structured decision-making framework for choosing between KANs and MLPs based on problem-specific requirements. Users should evaluate their priorities in **Accuracy**, **Interpretability**, and **Efficiency** to determine the optimal architecture.