\n
## Diagram: Treasure Collection Process
### Overview
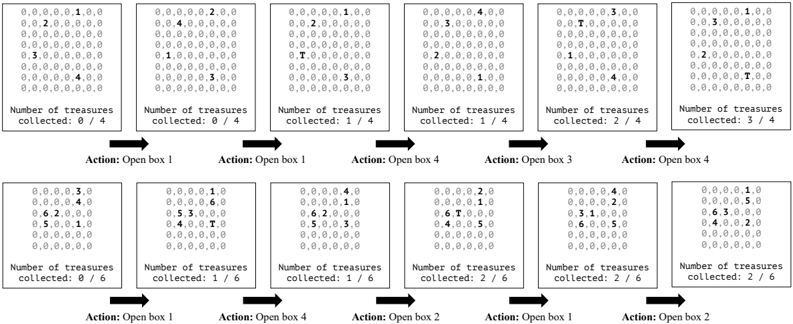
The image depicts a diagram illustrating a process of treasure collection, likely within a grid-based environment. The diagram shows a sequence of actions ("Action: Open box X") and their resulting impact on the number of treasures collected. Each step involves a grid representing a potential treasure location, with 'T' marking the location of a treasure. The diagram is arranged in two rows, each representing a different set of initial conditions or a different stage of the process.
### Components/Axes
The diagram consists of the following components:
* **Grids:** 12 grids, each representing a 10x10 area, populated with numbers (mostly 0s) and 'T' symbols.
* **Action Labels:** Labels below each grid indicating the action performed ("Action: Open box X", where X is a number from 1 to 4).
* **Treasure Count Labels:** Labels below the action labels indicating the number of treasures collected at that stage ("Number of treasures collected: X / Y").
* **Arrows:** Arrows connecting the grids, indicating the flow of the process.
There are no explicit axes in the traditional sense, but the grids can be considered as representing a spatial arrangement of potential treasure locations.
### Detailed Analysis or Content Details
**Row 1 (Top Row):**
1. **Grid 1:** Mostly 0s, with a few 1s and 2s. "Number of treasures collected: 0 / 4". Action: Open box 1.
2. **Grid 2:** Contains 0s, 1s, 2s, and a 'T' in the center. "Number of treasures collected: 0 / 4". Action: Open box 1.
3. **Grid 3:** Contains 0s, 1s, 2s, and a 'T' near the top. "Number of treasures collected: 1 / 4". Action: Open box 4.
4. **Grid 4:** Contains 0s, 1s, 2s, 3s, and a 'T' near the top. "Number of treasures collected: 1 / 4". Action: Open box 3.
5. **Grid 5:** Contains 0s, 1s, 2s, 3s, and a 'T' near the top. "Number of treasures collected: 2 / 4". Action: Open box 4.
6. **Grid 6:** Contains 0s, 1s, 2s, 3s, and a 'T' near the top. "Number of treasures collected: 3 / 4". Action: Open box 4.
**Row 2 (Bottom Row):**
1. **Grid 7:** Contains 0s, 3s, 4s, 5s, and a 'T' near the top. "Number of treasures collected: 0 / 6". Action: Open box 1.
2. **Grid 8:** Contains 0s, 1s, 3s, 4s, 5s, and a 'T' near the top. "Number of treasures collected: 1 / 6". Action: Open box 4.
3. **Grid 9:** Contains 0s, 2s, 4s, 5s, 6s, and a 'T' near the top. "Number of treasures collected: 1 / 6". Action: Open box 2.
4. **Grid 10:** Contains 0s, 2s, 4s, 5s, 6s, and a 'T' near the top. "Number of treasures collected: 2 / 6". Action: Open box 1.
5. **Grid 11:** Contains 0s, 2s, 4s, 5s, 6s, and a 'T' near the top. "Number of treasures collected: 2 / 6". Action: Open box 2.
6. **Grid 12:** Contains 0s, 1s, 3s, 4s, 5s, and a 'T' near the top. "Number of treasures collected: 2 / 6". Action: Open box 2.
The numbers within the grids appear to represent some kind of value or density associated with each cell. The 'T' symbol consistently indicates the location of a treasure.
### Key Observations
* The number of treasures collected increases with each action in both rows.
* The action "Open box 4" appears frequently in both rows.
* The initial number of treasures to be collected differs between the two rows (4 in the top row, 6 in the bottom row).
* The distribution of numbers within the grids varies, suggesting different levels of "treasure potential" in different areas.
* The 'T' symbol is not always in the same location within the grids.
### Interpretation
This diagram likely represents a simplified model of a treasure-hunting process. The grids represent a search space, and the numbers within the grids could represent the probability of finding a treasure in that location, or the value of the treasure if found. The actions ("Open box X") represent attempts to locate treasures.
The diagram demonstrates that opening certain boxes (e.g., box 4) is more likely to lead to treasure discovery than others. The increasing treasure count with each action suggests a successful search strategy. The difference in initial treasure counts between the two rows could represent different levels of difficulty or different starting conditions.
The presence of numbers other than 0 and 'T' within the grids is intriguing. These numbers could represent a "heat map" of treasure potential, where higher numbers indicate a greater likelihood of finding a treasure. The diagram could be used to analyze the effectiveness of different search strategies and to optimize the process of treasure collection. The diagram is a visual representation of a state machine, where each grid represents a state, and the actions represent transitions between states. The treasure count represents the accumulated reward.