## Diagram: Treasure Collection Process
### Overview
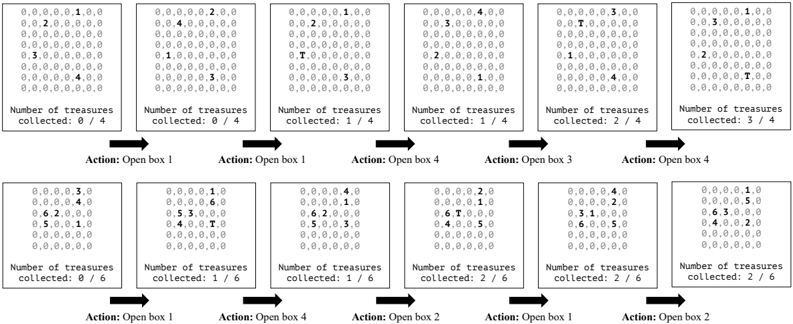
The image depicts a sequential process of treasure collection across two rows of boxes. Each box contains numerical values and a "T" symbol, with arrows indicating actions (e.g., "Open box 1") that transition between states. The bottom row tracks the number of treasures collected, incrementing as boxes are opened.
### Components/Axes
- **Top Row Boxes**:
- Labeled with numbers (1–4) and "T" symbols (e.g., "T" in box 1, "T" in box 3).
- Each box contains a grid of 6 cells (e.g., "0,0,0,0,0,1" in the first box).
- Text: "Number of treasures collected: X / Y" (e.g., "0 / 4" initially).
- **Bottom Row Boxes**:
- Similar grid structure but with higher numerical values (e.g., "6,2,0,0,0,0").
- Text: "Number of treasures collected: X / 6" (e.g., "0 / 6" initially).
- **Arrows**:
- Labeled with actions (e.g., "Action: Open box 1").
- Connect top and bottom row boxes, indicating state transitions.
### Detailed Analysis
1. **Top Row Progression**:
- Initial state: All boxes have "0" in most cells, with "T" in specific positions (e.g., box 1 has "T" in the 5th cell).
- After "Open box 1": Box 1’s grid changes to "0,0,0,0,1,0" (treasure collected).
- Subsequent actions (e.g., "Open box 4") update grids and increment the "collected" count (e.g., "3 / 4").
2. **Bottom Row Progression**:
- Initial state: All boxes have "0" in most cells.
- After "Open box 1": Box 1’s grid updates to "0,0,0,0,1,0" (treasure collected).
- Subsequent actions (e.g., "Open box 4") update grids and increment the "collected" count (e.g., "2 / 6").
3. **Action Flow**:
- Arrows show a left-to-right sequence:
- Top row: Open box 1 → Open box 1 → Open box 4 → Open box 3 → Open box 4.
- Bottom row: Open box 1 → Open box 4 → Open box 2 → Open box 1 → Open box 2.
### Key Observations
- **Treasure Distribution**:
- Top row treasures are sparse (e.g., "T" in 1/4 boxes), while bottom row treasures are denser (e.g., "T" in 2/6 boxes).
- **Count Incrementation**:
- Top row progresses from 0/4 to 3/4, while bottom row progresses from 0/6 to 2/6.
- **Action Consistency**:
- Repeated actions (e.g., "Open box 1" twice) suggest iterative treasure collection.
### Interpretation
The diagram illustrates a systematic process of treasure collection, where each action (opening a box) reveals or collects treasures. The top row represents a smaller-scale collection (4 total treasures), while the bottom row involves a larger-scale process (6 total treasures). The "T" symbols likely denote successful treasure retrieval, and the numerical grids may represent hidden values or probabilities. The repeated actions suggest a trial-and-error mechanism, with each box opening refining the collection strategy. The discrepancy in collected counts (3/4 vs. 2/6) implies varying efficiency or constraints between the two processes.