## Scatter Plot: Layer 1, Head 16
### Overview
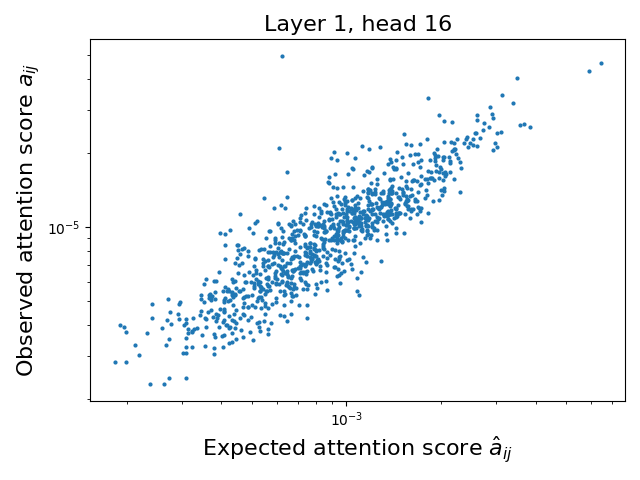
The image is a scatter plot comparing observed attention scores (`a_ij`) to expected attention scores (`â_ij`) for a neural network layer (Layer 1, Head 16). Both axes use a logarithmic scale, with data points distributed across a wide range of values. The plot suggests a general positive correlation between observed and expected scores, though with notable variability.
---
### Components/Axes
- **X-axis (Expected attention score, â_ij)**: Logarithmic scale ranging approximately from 10⁻³ to 10⁻¹.
- **Y-axis (Observed attention score, a_ij)**: Logarithmic scale ranging approximately from 10⁻⁵ to 10⁻³.
- **Legend**: Positioned at the top of the plot, labeled "Layer 1, head 16" in black text.
- **Data Points**: Blue dots representing individual (observed, expected) score pairs.
---
### Detailed Analysis
- **Trend**: The majority of data points cluster along a diagonal band from the bottom-left to the top-right, indicating a positive correlation between observed and expected scores. However, the spread is significant, with points deviating from the diagonal in all directions.
- **Outliers**:
- A few points in the top-right corner (observed > expected) suggest overestimation of attention scores.
- Points in the bottom-left corner (observed < expected) indicate underestimation.
- **Log Scale Implications**: The logarithmic axes compress high-value ranges, emphasizing relative differences rather than absolute magnitudes. This is critical for interpreting attention scores, which often span orders of magnitude.
---
### Key Observations
1. **Positive Correlation**: Most points align with the diagonal, suggesting the model’s expected scores generally align with observed behavior.
2. **Variability**: The spread of points implies inconsistencies in attention score predictions, potentially due to noise, model architecture, or input variability.
3. **Outlier Behavior**: Extreme deviations (e.g., top-right and bottom-left points) may highlight edge cases or model limitations in specific scenarios.
---
### Interpretation
The plot demonstrates that the attention mechanism in Layer 1, Head 16, produces scores that are broadly consistent with expectations but exhibit notable variability. The logarithmic scale highlights the dynamic range of attention scores, which is typical in transformer models where attention weights can vary exponentially.
- **Model Behavior**: The diagonal trend suggests the model’s attention distribution is somewhat predictable, but the spread indicates potential instability or sensitivity to input perturbations.
- **Practical Implications**: The outliers may correspond to specific input tokens or contexts where the model’s attention mechanism behaves unexpectedly, warranting further investigation (e.g., adversarial examples, rare linguistic patterns).
- **Technical Insight**: The use of logarithmic axes is critical for visualizing attention scores, as linear scales would obscure the relationships between low- and high-magnitude values.
This analysis underscores the importance of attention score consistency in neural networks while highlighting areas for improvement in model robustness.