\n
## Scatter Plot: Reasoning Tokens vs. Problem Size for deepseek/deepseek-r1
### Overview
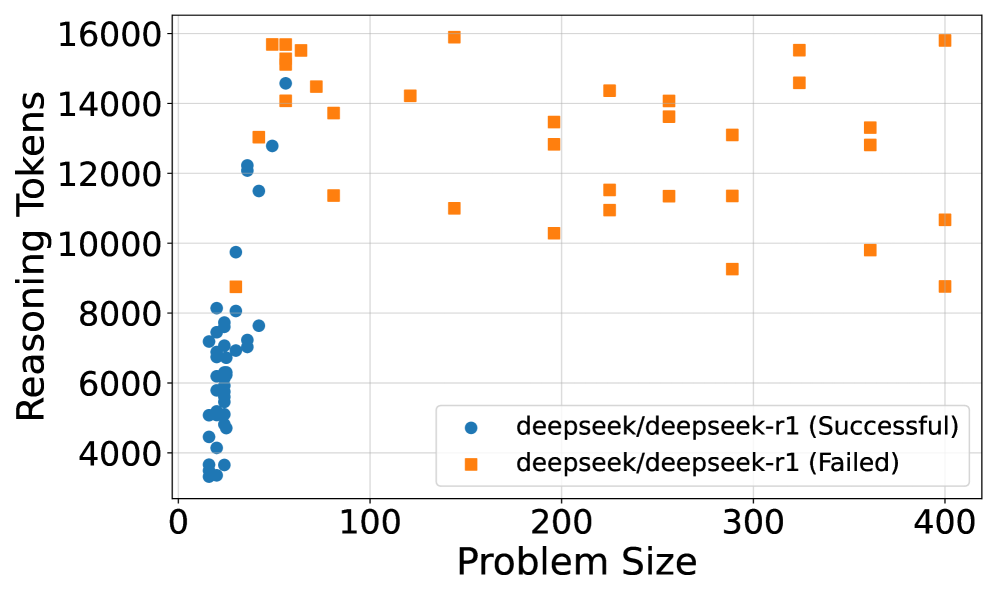
This scatter plot visualizes the relationship between "Problem Size" and "Reasoning Tokens" for the model `deepseek/deepseek-r1`, differentiating between successful and failed attempts. The x-axis represents Problem Size, and the y-axis represents Reasoning Tokens. Two distinct data series are plotted: one for successful runs (blue circles) and one for failed runs (orange squares).
### Components/Axes
* **X-axis:** Problem Size (ranging from approximately 0 to 400)
* **Y-axis:** Reasoning Tokens (ranging from approximately 4000 to 16000)
* **Legend:** Located in the bottom-right corner.
* Blue circles: `deepseek/deepseek-r1 (Successful)`
* Orange squares: `deepseek/deepseek-r1 (Failed)`
* **Gridlines:** Present to aid in reading values.
### Detailed Analysis
**Successful Runs (Blue Circles):**
The blue data series shows a cluster of points concentrated at lower Problem Sizes (0-50). The trend is generally upward, but with significant scatter.
* At Problem Size 0, Reasoning Tokens range from approximately 4500 to 9500.
* At Problem Size 20, Reasoning Tokens range from approximately 6000 to 10000.
* At Problem Size 50, Reasoning Tokens range from approximately 6000 to 12000.
* Beyond Problem Size 100, the successful runs become more sparse, with Reasoning Tokens ranging from approximately 7000 to 14000.
* At Problem Size 400, there is one successful run at approximately 8000 Reasoning Tokens.
**Failed Runs (Orange Squares):**
The orange data series exhibits a wider distribution across the Problem Size range.
* At Problem Size 50, Reasoning Tokens range from approximately 11000 to 15000.
* At Problem Size 100, Reasoning Tokens range from approximately 11000 to 16000.
* At Problem Size 200, Reasoning Tokens range from approximately 11000 to 14000.
* At Problem Size 300, Reasoning Tokens range from approximately 11000 to 15000.
* At Problem Size 400, Reasoning Tokens range from approximately 9000 to 15000.
### Key Observations
* Successful runs tend to occur with lower Reasoning Token counts, especially for smaller Problem Sizes.
* Failed runs consistently require higher Reasoning Token counts across all Problem Sizes.
* There is significant variability in Reasoning Tokens for both successful and failed runs, suggesting other factors influence the outcome.
* The density of successful runs decreases as Problem Size increases, while the density of failed runs remains relatively consistent.
* There is an outlier failed run at Problem Size 400 with a Reasoning Token count of approximately 9000, which is lower than most other failed runs.
### Interpretation
The data suggests a correlation between Problem Size, Reasoning Tokens, and success rate for the `deepseek/deepseek-r1` model. Larger Problem Sizes generally require more Reasoning Tokens, and a higher Reasoning Token count is associated with a higher probability of failure. The model appears to struggle with larger problems, potentially due to limitations in its reasoning capacity or the complexity of the problem space. The scatter suggests that Reasoning Tokens are not the *sole* determinant of success; other factors likely play a role. The outlier at Problem Size 400 indicates that failure isn't always tied to high token usage, and there may be specific problem instances that are particularly challenging even with relatively low reasoning costs. The concentration of successful runs at lower Problem Sizes and Reasoning Token counts suggests an optimal operating range for this model.