## Scatter Plot: Reasoning Tokens vs. Problem Size for deepseek/deepseek-r1
### Overview
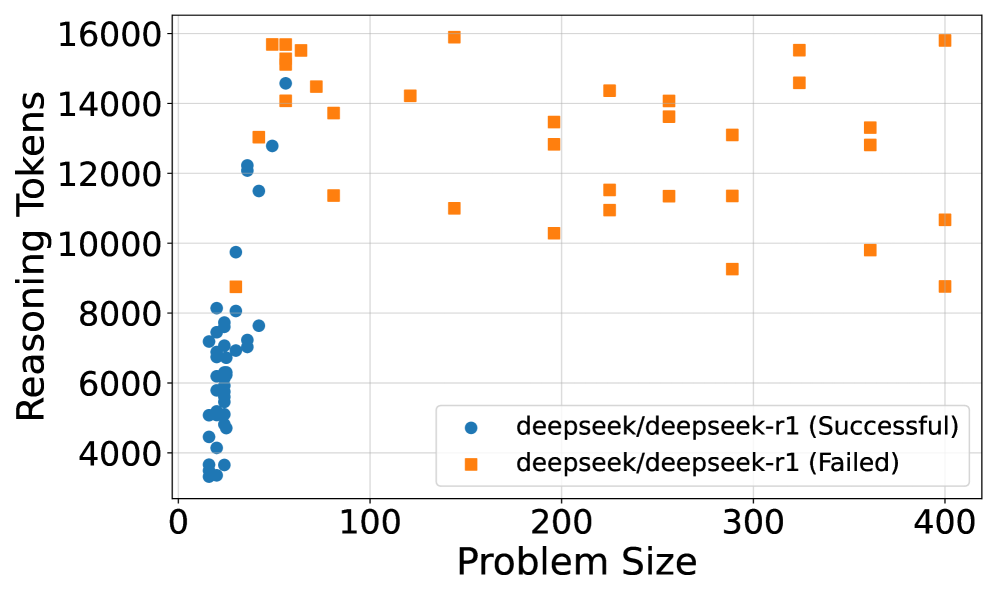
This scatter plot compares the number of reasoning tokens used by the deepseek/deepseek-r1 model across varying problem sizes, distinguishing between successful and failed outcomes. The x-axis represents problem size (0–400), and the y-axis represents reasoning tokens (4,000–16,000). Two data series are plotted: blue circles for successful runs and orange squares for failed runs.
### Components/Axes
- **X-axis (Problem Size)**:
- Range: 0 to 400 (linear scale).
- Labels: Incremented by 100 (0, 100, 200, 300, 400).
- **Y-axis (Reasoning Tokens)**:
- Range: 4,000 to 16,000 (linear scale).
- Labels: Incremented by 2,000 (4,000, 6,000, 8,000, 10,000, 12,000, 14,000, 16,000).
- **Legend**:
- Position: Bottom-right corner.
- Labels:
- Blue circles: "deepseek/deepseek-r1 (Successful)".
- Orange squares: "deepseek/deepseek-r1 (Failed)".
### Detailed Analysis
- **Successful Runs (Blue Circles)**:
- **Problem Size**: Concentrated between 0 and 100.
- **Reasoning Tokens**: Clustered between ~4,000 and ~14,000, with a peak density near 8,000 tokens.
- **Distribution**: Approximately 30–40 data points, tightly grouped in the lower-left quadrant.
- **Failed Runs (Orange Squares)**:
- **Problem Size**: Spread across 50–400, with higher density above 150.
- **Reasoning Tokens**: Range from ~8,000 to ~16,000, with a notable outlier at ~16,000 tokens for problem size 400.
- **Distribution**: Approximately 30–40 data points, dispersed diagonally from lower-left to upper-right.
### Key Observations
1. **Inverse Relationship**: Successful runs dominate at smaller problem sizes (0–100), while failed runs increase as problem size grows.
2. **Token Usage**:
- Successful runs use fewer tokens on average (~6,000–10,000).
- Failed runs use more tokens (~10,000–16,000), suggesting higher computational effort for unresolved problems.
3. **Outliers**:
- A single failed run at problem size 400 uses ~16,000 tokens, the maximum observed.
- Successful runs at problem size 100 use ~12,000–14,000 tokens, indicating edge-case complexity.
### Interpretation
The data suggests that deepseek/deepseek-r1 performs well on smaller problems but struggles with larger ones. Successful runs cluster at lower problem sizes and token usage, while failed runs correlate with higher problem sizes and token consumption. This implies that the model’s reasoning capacity is limited by problem complexity, requiring more resources (tokens) for larger inputs but failing more frequently. The outlier at problem size 400 highlights a potential failure mode where extreme token usage does not guarantee success. The trend underscores the need for optimization in handling larger-scale reasoning tasks.