## Chart: Accuracy Comparison of ReST and Ours Models
### Overview
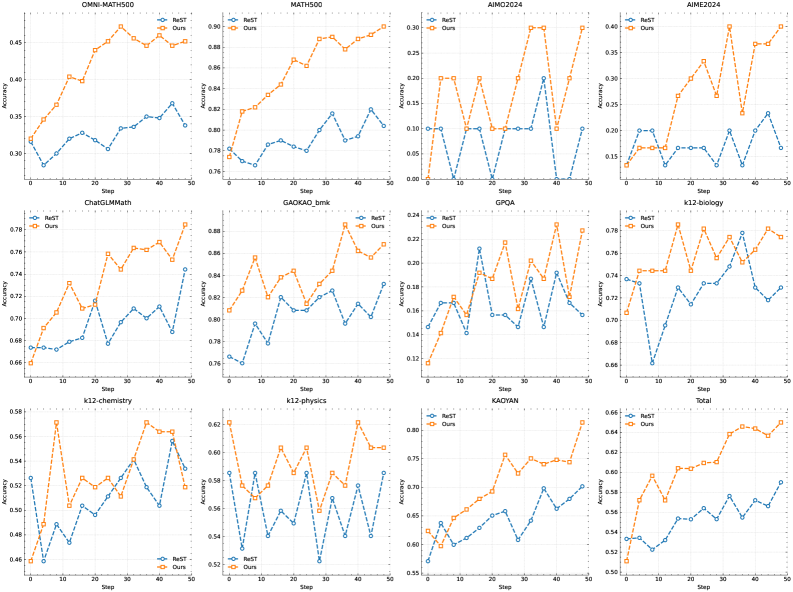
The image presents a series of line charts comparing the accuracy of two models, "ReST" and "Ours," across various datasets. Each chart displays the accuracy of both models as a function of "Step," presumably representing training iterations or data batches. The charts are arranged in a 3x4 grid, each focusing on a different dataset or a combined total.
### Components/Axes
* **X-axis (Step):** Ranges from 0 to 50 in increments of 10.
* **Y-axis (Accuracy):** Varies depending on the chart, but generally spans a range of 0.0 to 1.0.
* **Legend:** Located at the bottom of each chart.
* **Blue:** Represents the "ReST" model.
* **Orange:** Represents the "Ours" model.
* **Chart Titles:** Indicate the dataset used for each chart (e.g., "OMNI-MATH500", "MATH500", "AIM02024", "AIME2024", "ChatGLMMath", "GAOKAO\_bmk", "GPQA", "k12-biology", "k12-chemistry", "k12-physics", "KAOYAN", "Total").
### Detailed Analysis
**1. OMNI-MATH500 (Top-Left)**
* **ReST (Blue):** Starts at approximately 0.32, dips slightly to 0.28 around step 5, then gradually increases to approximately 0.36 by step 50.
* **Ours (Orange):** Starts at approximately 0.33, increases sharply to approximately 0.46 by step 20, plateaus, and ends at approximately 0.45 by step 50.
**2. MATH500 (Top-Middle)**
* **ReST (Blue):** Starts at approximately 0.78, fluctuates between 0.78 and 0.82, and ends at approximately 0.82 by step 50.
* **Ours (Orange):** Starts at approximately 0.78, increases steadily to approximately 0.90 by step 50.
**3. AIM02024 (Top-Right)**
* **ReST (Blue):** Starts at approximately 0.10, remains relatively constant around 0.10, with a dip to 0.00 at step 30, and ends at approximately 0.10 by step 50.
* **Ours (Orange):** Starts at approximately 0.10, fluctuates between 0.10 and 0.30, and ends at approximately 0.20 by step 50.
**4. AIME2024 (Top-Right)**
* **ReST (Blue):** Starts at approximately 0.15, fluctuates between 0.15 and 0.22, and ends at approximately 0.22 by step 50.
* **Ours (Orange):** Starts at approximately 0.15, increases to approximately 0.38 by step 30, and ends at approximately 0.30 by step 50.
**5. ChatGLMMath (Middle-Left)**
* **ReST (Blue):** Starts at approximately 0.68, fluctuates between 0.68 and 0.72, and ends at approximately 0.75 by step 50.
* **Ours (Orange):** Starts at approximately 0.67, increases to approximately 0.77 by step 30, and ends at approximately 0.76 by step 50.
**6. GAOKAO\_bmk (Middle-Middle)**
* **ReST (Blue):** Starts at approximately 0.76, fluctuates between 0.76 and 0.82, and ends at approximately 0.82 by step 50.
* **Ours (Orange):** Starts at approximately 0.80, fluctuates between 0.80 and 0.88, and ends at approximately 0.86 by step 50.
**7. GPQA (Middle-Right)**
* **ReST (Blue):** Starts at approximately 0.16, fluctuates between 0.14 and 0.20, and ends at approximately 0.16 by step 50.
* **Ours (Orange):** Starts at approximately 0.16, fluctuates between 0.16 and 0.22, and ends at approximately 0.16 by step 50.
**8. k12-biology (Middle-Right)**
* **ReST (Blue):** Starts at approximately 0.74, fluctuates between 0.68 and 0.74, and ends at approximately 0.75 by step 50.
* **Ours (Orange):** Starts at approximately 0.74, increases to approximately 0.78 by step 30, and ends at approximately 0.78 by step 50.
**9. k12-chemistry (Bottom-Left)**
* **ReST (Blue):** Starts at approximately 0.52, fluctuates between 0.46 and 0.52, and ends at approximately 0.52 by step 50.
* **Ours (Orange):** Starts at approximately 0.46, fluctuates between 0.46 and 0.58, and ends at approximately 0.54 by step 50.
**10. k12-physics (Bottom-Middle)**
* **ReST (Blue):** Starts at approximately 0.52, fluctuates between 0.52 and 0.58, and ends at approximately 0.58 by step 50.
* **Ours (Orange):** Starts at approximately 0.58, fluctuates between 0.58 and 0.62, and ends at approximately 0.58 by step 50.
**11. KAOYAN (Bottom-Right)**
* **ReST (Blue):** Starts at approximately 0.58, increases to approximately 0.70 by step 30, and ends at approximately 0.70 by step 50.
* **Ours (Orange):** Starts at approximately 0.60, increases to approximately 0.75 by step 30, and ends at approximately 0.75 by step 50.
**12. Total (Bottom-Right)**
* **ReST (Blue):** Starts at approximately 0.52, increases to approximately 0.60 by step 30, and ends at approximately 0.60 by step 50.
* **Ours (Orange):** Starts at approximately 0.58, increases to approximately 0.66 by step 30, and ends at approximately 0.64 by step 50.
### Key Observations
* The "Ours" model generally outperforms the "ReST" model across most datasets, particularly in "MATH500" and "OMNI-MATH500."
* In some datasets, such as "AIM02024" and "GPQA," the performance of both models is relatively low and fluctuates significantly.
* The "Total" chart suggests that, overall, the "Ours" model achieves higher accuracy than the "ReST" model.
### Interpretation
The charts provide a comparative analysis of the accuracy of two models ("ReST" and "Ours") across a range of datasets. The "Ours" model appears to be more effective in most cases, demonstrating a higher accuracy and a more consistent upward trend as the "Step" increases. However, the performance varies significantly depending on the dataset, indicating that the models may have different strengths and weaknesses when applied to different types of problems. The "Total" chart summarizes the overall performance, suggesting that the "Ours" model is generally superior. The fluctuations in accuracy observed in some datasets may be due to the complexity of the data or the specific training parameters used.