\n
## Line Charts: Accuracy vs. Step for Various Datasets
### Overview
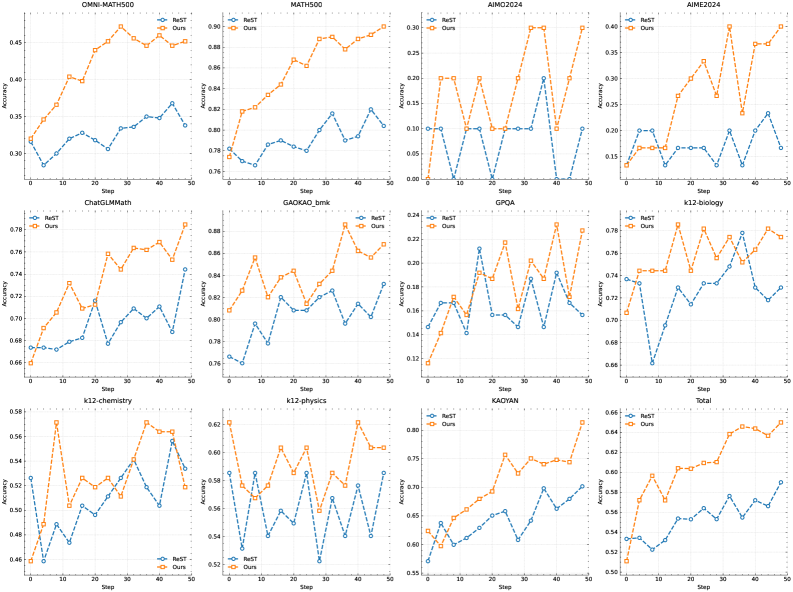
The image presents a grid of 12 line charts, each depicting the relationship between "Accuracy" and "Step" for different datasets. Two lines are plotted on each chart, representing two methods: "ReST" and "Ours". The charts are arranged in a 3x4 grid.
### Components/Axes
* **X-axis:** "Step", ranging from 0 to 50, with markers at intervals of 10.
* **Y-axis:** "Accuracy", with varying scales depending on the dataset.
* **Datasets (Chart Titles):**
* OMNI-MATH500
* MATH500
* AIM0204
* AIME2024
* ChatGPTMath
* GAOKAO_bmk
* GPQA
* k12-biology
* k12-chemistry
* k12-physics
* KAIYAN
* Total
* **Lines:**
* "ReST" (Blue line with circle markers)
* "Ours" (Orange line with circle markers)
* **Legend:** Located in the top-left corner of each chart, indicating the line colors and corresponding methods.
### Detailed Analysis or Content Details
Here's a breakdown of each chart, noting trends and approximate data points. Accuracy values are approximate due to the resolution of the image.
1. **OMNI-MATH500:** The "Ours" line starts at approximately 0.42 and generally fluctuates between 0.42 and 0.46, with a slight upward trend. The "ReST" line starts at approximately 0.38 and shows a more pronounced upward trend, reaching around 0.44 by step 50.
2. **MATH500:** "Ours" starts at around 0.86 and remains relatively stable, fluctuating between 0.84 and 0.88. "ReST" starts at around 0.80 and shows a slight upward trend, reaching approximately 0.83 by step 50.
3. **AIM0204:** "Ours" starts at approximately 0.23 and fluctuates significantly, ranging from 0.10 to 0.25. "ReST" starts at around 0.12 and also fluctuates, with a similar range.
4. **AIME2024:** "Ours" starts at approximately 0.32 and fluctuates between 0.25 and 0.35. "ReST" starts at around 0.20 and shows a similar fluctuating pattern.
5. **ChatGPTMath:** "Ours" starts at approximately 0.72 and fluctuates between 0.68 and 0.76. "ReST" starts at around 0.70 and shows a similar fluctuating pattern.
6. **GAOKAO_bmk:** "Ours" starts at approximately 0.84 and remains relatively stable, fluctuating between 0.82 and 0.86. "ReST" starts at around 0.80 and shows a slight upward trend, reaching approximately 0.83 by step 50.
7. **GPQA:** "Ours" starts at approximately 0.20 and fluctuates between 0.15 and 0.23. "ReST" starts at around 0.14 and shows a similar fluctuating pattern.
8. **k12-biology:** "Ours" starts at approximately 0.72 and fluctuates between 0.68 and 0.76. "ReST" starts at around 0.70 and shows a similar fluctuating pattern.
9. **k12-chemistry:** "Ours" starts at approximately 0.72 and fluctuates between 0.68 and 0.76. "ReST" starts at around 0.70 and shows a similar fluctuating pattern.
10. **k12-physics:** "Ours" starts at approximately 0.76 and fluctuates between 0.72 and 0.80. "ReST" starts at around 0.72 and shows a similar fluctuating pattern.
11. **KAIYAN:** "Ours" starts at approximately 0.18 and fluctuates between 0.15 and 0.22. "ReST" starts at around 0.15 and shows a similar fluctuating pattern.
12. **Total:** "Ours" starts at approximately 0.68 and fluctuates between 0.64 and 0.72. "ReST" starts at around 0.66 and shows a similar fluctuating pattern.
### Key Observations
* The "Ours" method generally exhibits more stable performance across most datasets, with less pronounced fluctuations compared to "ReST".
* "ReST" often shows a slight upward trend in accuracy as the "Step" increases, particularly in OMNI-MATH500 and MATH500.
* The AIM0204, AIME2024, GPQA, and KAIYAN datasets show significant fluctuations for both methods, indicating a more challenging learning process.
* The k12 datasets (biology, chemistry, physics) show relatively stable performance for both methods.
### Interpretation
The charts compare the performance of two methods, "ReST" and "Ours", across a diverse set of datasets. The "Accuracy" metric indicates how well each method performs as the "Step" (likely representing training iterations or steps) increases.
The consistent stability of "Ours" suggests it may be less sensitive to the specific dataset or training process, providing a more reliable baseline performance. The upward trend observed in "ReST" for some datasets indicates that it may benefit from continued training, potentially surpassing "Ours" with more steps.
The high variability in datasets like AIM0204 and GPQA suggests these datasets are more complex or noisy, making it harder for either method to achieve consistent accuracy. The relatively stable performance on the k12 datasets suggests these datasets are more well-defined and easier to learn from.
The overall comparison suggests that the choice between "ReST" and "Ours" depends on the specific application and the characteristics of the dataset. If stability is paramount, "Ours" may be preferred. If there is potential for improvement with continued training, "ReST" may be a better choice.