# Technical Document Extraction: Scatter Plot Analysis
## 1. **Chart Title and Axes**
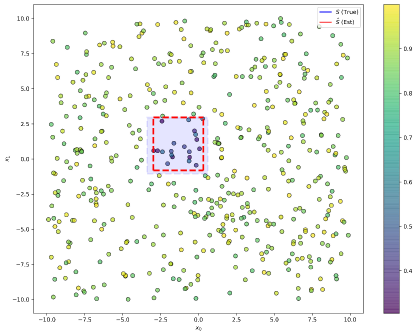
- **Title**: "Scatter Plot of True vs Estimated Values"
- **X-Axis**: Labeled `x₀`, ranging from -10.0 to 10.0.
- **Y-Axis**: Labeled `x₁`, ranging from -10.0 to 10.0.
## 2. **Legend and Data Series**
- **Legend**: Located in the **top-right corner** of the plot.
- **Blue Dots**: Labeled `S (True)` (True values).
- **Red Dots**: Labeled `S (Est)` (Estimated values).
- **Color Bar**:
- Located on the **right side** of the plot.
- Gradient ranges from **purple (0.4)** to **yellow (0.9)**, indicating a value associated with the data points.
- **Note**: The color bar is not explicitly tied to the legend labels (`S (True)`/`S (Est)`), suggesting it may represent a third variable or a secondary metric (e.g., confidence, error magnitude, or density). This requires further clarification.
## 3. **Data Point Distribution**
- **True Values (`S (True)`)**:
- **Color**: Blue.
- **Trend**: Clustered in the **central region** of the plot (approximately `x₀ ∈ [-2.5, 2.5]` and `x₁ ∈ [-2.5, 2.5]`).
- **Highlighted Region**: A **red dashed square** encloses a dense cluster of blue dots, emphasizing a localized concentration of true values.
- **Estimated Values (`S (Est)`)**:
- **Color**: Red.
- **Trend**: More **spread out** across the plot, with no clear central clustering.
- **Overlap**: Some red dots overlap with blue dots, indicating estimation errors or variability.
## 4. **Spatial Grounding of Legend**
- **Legend Position**: Top-right corner (coordinates approximately `[9.5, 9.5]` based on axis limits).
- **Color Consistency Check**:
- Blue dots (`S (True)`) match the legend's blue label.
- Red dots (`S (Est)`) match the legend's red label.
- **Color Bar**: No direct correlation with legend labels; its gradient (purple to yellow) is independent of the blue/red series.
## 5. **Trend Verification**
- **True Values (`S (True)`)**:
- **Visual Trend**: Concentrated in the center, forming a dense cluster. This suggests a central tendency or a known ground truth distribution.
- **Estimated Values (`S (Est)`)**:
- **Visual Trend**: Dispersed across the plot, with no clear pattern. This indicates potential estimation errors or variability in the model's predictions.
## 6. **Component Isolation**
- **Header**: Title and legend (top-right).
- **Main Chart**: Scatter plot with two data series and a highlighted region.
- **Footer**: No explicit footer; color bar is part of the main chart.
## 7. **Additional Observations**
- **Color Bar Ambiguity**: The color gradient (purple to yellow) is not explicitly linked to the legend labels. It may represent a third variable (e.g., confidence score, error magnitude) or a density metric. Without further context, this remains speculative.
- **Highlighted Region**: The red dashed square focuses on a subset of true values, possibly indicating a region of interest (e.g., high-density area, anomaly, or validation zone).
## 8. **Conclusion**
The plot compares **true values** (`S (True)`) and **estimated values** (`S (Est)`) in a 2D space. True values are centrally clustered, while estimated values are dispersed, suggesting estimation challenges. The color bar introduces an additional metric but lacks explicit labeling, requiring further investigation for interpretation.