## Bar Chart: Overall Accuracy Comparison
### Overview
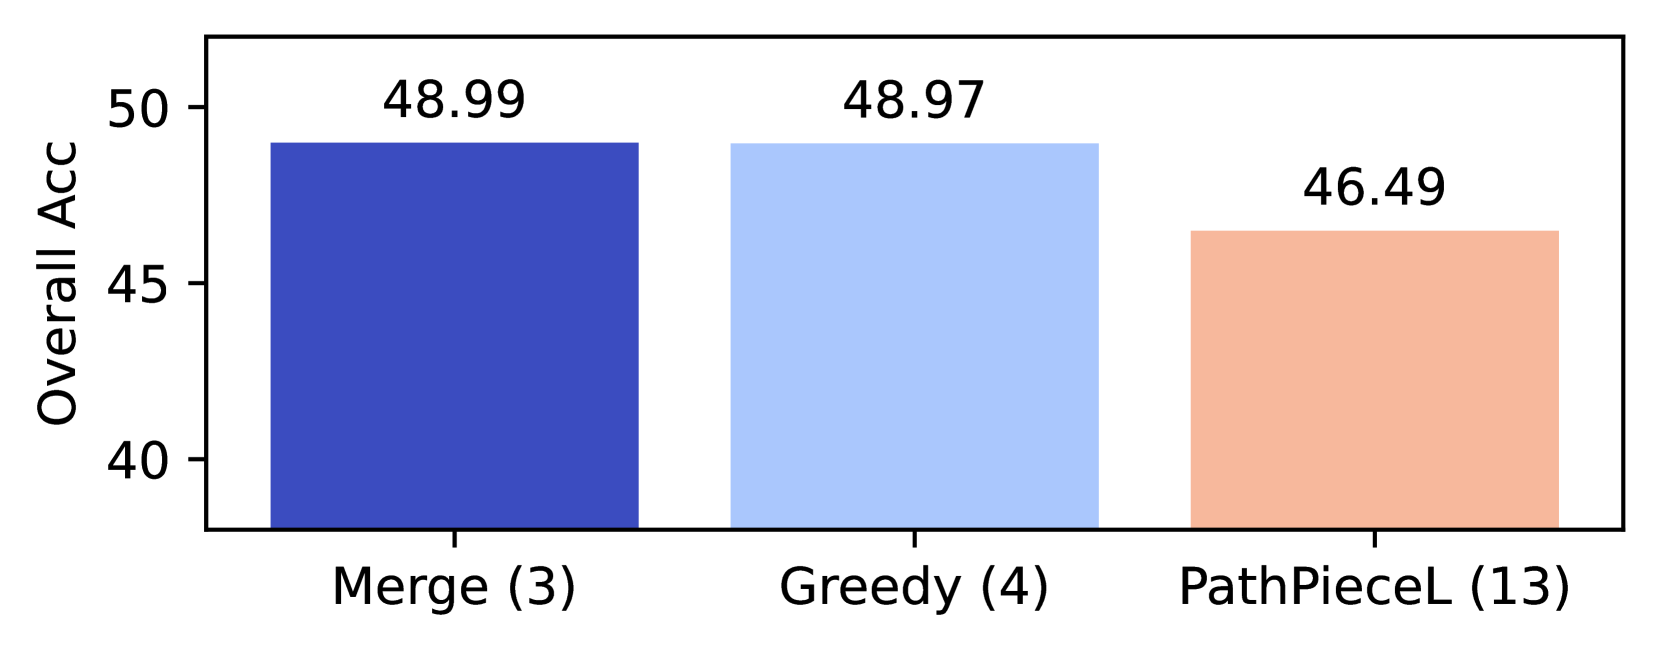
The image is a bar chart comparing the overall accuracy of three different methods: Merge, Greedy, and PathPieceL. The y-axis represents the overall accuracy, ranging from 40 to 50. Each method is represented by a bar, with its corresponding accuracy value displayed above it.
### Components/Axes
* **Y-axis:** "Overall Acc" with scale markers at 40, 45, and 50.
* **X-axis:** Categorical axis with three categories: "Merge (3)", "Greedy (4)", and "PathPieceL (13)".
* **Bars:**
* "Merge (3)": Dark blue bar.
* "Greedy (4)": Light blue bar.
* "PathPieceL (13)": Light orange bar.
### Detailed Analysis
* **Merge (3):** The dark blue bar representing the "Merge" method has an accuracy of 48.99.
* **Greedy (4):** The light blue bar representing the "Greedy" method has an accuracy of 48.97.
* **PathPieceL (13):** The light orange bar representing the "PathPieceL" method has an accuracy of 46.49.
### Key Observations
* The "Merge" method has the highest overall accuracy (48.99), closely followed by the "Greedy" method (48.97).
* The "PathPieceL" method has a noticeably lower overall accuracy (46.49) compared to the other two methods.
### Interpretation
The bar chart suggests that the "Merge" and "Greedy" methods perform similarly in terms of overall accuracy, while the "PathPieceL" method underperforms compared to the other two. The numbers in parentheses next to each method name might indicate the number of instances or trials associated with each method, but without further context, this is speculative. The difference in accuracy between "Merge" and "Greedy" is minimal (0.02), suggesting that their performance is practically equivalent.