\n
## Chart: Density Plot of Sampled 'r' Values
### Overview
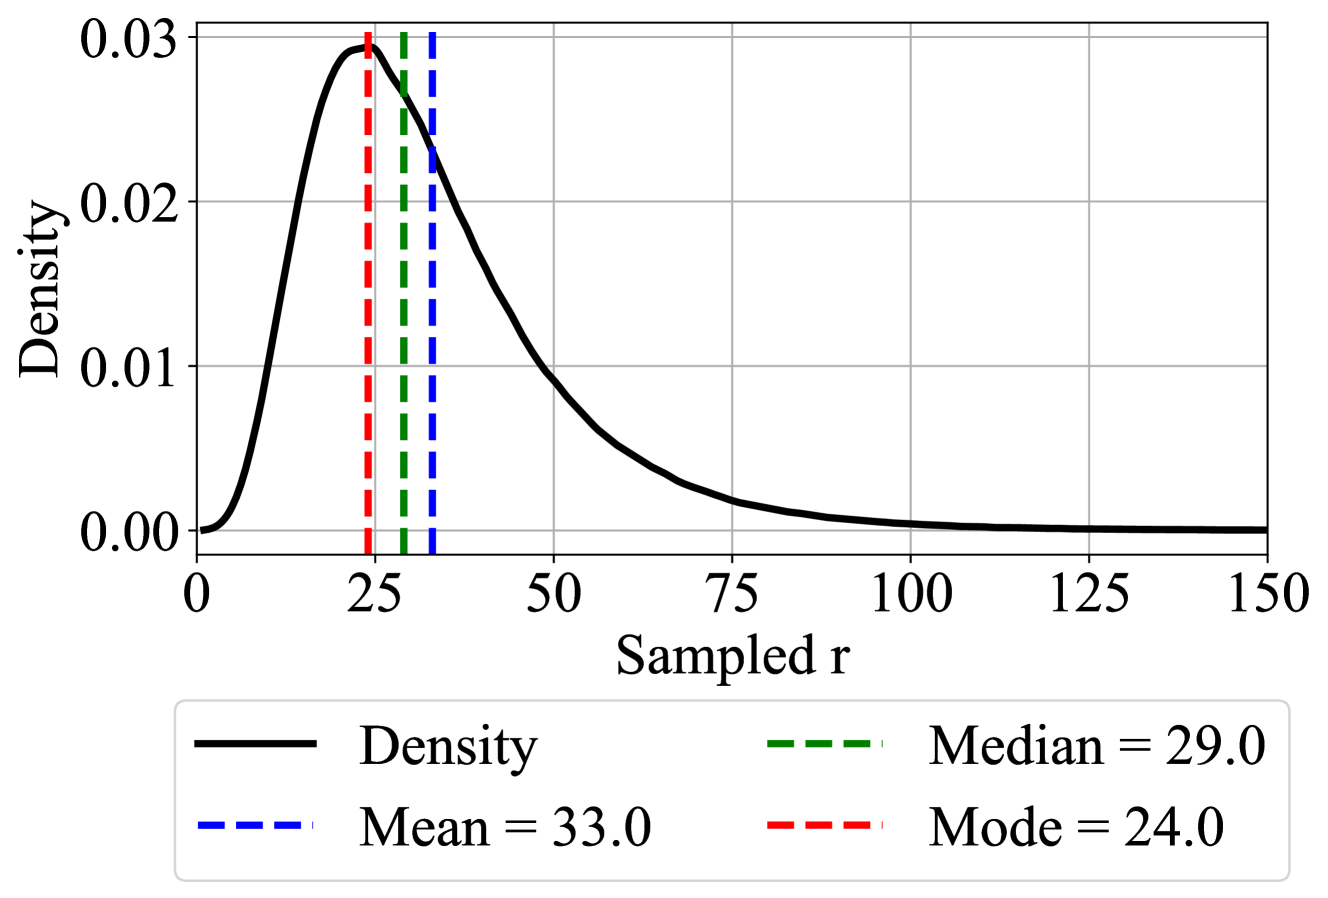
The image presents a density plot illustrating the distribution of sampled 'r' values. The plot shows the probability density of the 'r' values, with the x-axis representing the 'r' values themselves and the y-axis representing the density. Several vertical lines indicate the mean, median, and mode of the distribution.
### Components/Axes
* **X-axis:** Labeled "Sampled r", ranging from 0 to 150, with tick marks at intervals of 25.
* **Y-axis:** Labeled "Density", ranging from 0.00 to 0.03, with tick marks at intervals of 0.01.
* **Curve:** A solid black line representing the density function.
* **Legend:** Located at the bottom-center of the image, providing labels and values for the vertical lines:
* Solid Black Line: "Density"
* Dashed Blue Line: "Mean = 33.0"
* Dashed Green Line: "Median = 29.0"
* Dashed Red Line: "Mode = 24.0"
### Detailed Analysis
The density curve starts at approximately 0.00 at r=0, rises to a peak density of approximately 0.027 at r=24, then gradually declines to approximately 0.00 at r=150.
* **Mean:** A vertical dashed blue line is positioned at r = 33.0.
* **Median:** A vertical dashed green line is positioned at r = 29.0.
* **Mode:** A vertical dashed red line is positioned at r = 24.0.
The distribution is right-skewed, meaning it has a longer tail on the right side. The mode (24.0) is less than the median (29.0), which is less than the mean (33.0), confirming the right skew.
### Key Observations
* The distribution is unimodal, with a single peak at the mode.
* The mean, median, and mode are relatively close together, suggesting the distribution is not extremely skewed, but a slight right skew is present.
* The density decreases rapidly after the mode, indicating that values of 'r' greater than 30 are less frequent.
### Interpretation
The data suggests that the sampled 'r' values are concentrated around 24, with a tendency towards higher values, as indicated by the mean being greater than the mode. The right skew implies that there are some relatively high 'r' values that pull the mean upwards, but these values are not very common. This type of distribution could arise in scenarios where 'r' represents a quantity that is bounded at zero but has the potential to increase significantly, but is more likely to be small. The difference between the mean, median, and mode provides insight into the shape of the distribution and the presence of outliers or skewness. The data is descriptive of a single variable, 'r', and does not show relationships between variables.