## Line Chart: Accuracy vs. Time for Different Parameter Settings
### Overview
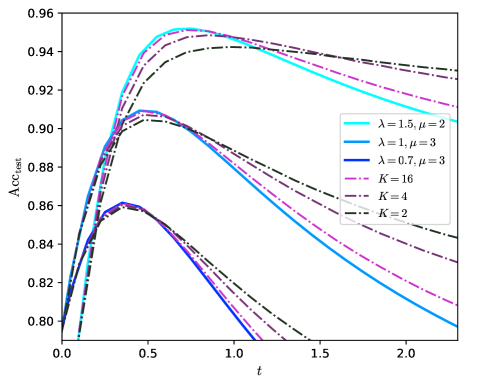
The image is a line chart showing the relationship between test accuracy (Acc_test) and time (t) for different parameter settings of a model. The parameters include λ, μ, and K. The chart displays multiple lines, each representing a unique combination of these parameters.
### Components/Axes
* **X-axis (Horizontal):** Labeled as "t", ranging from 0.0 to 2.0 in increments of 0.5.
* **Y-axis (Vertical):** Labeled as "Acc_test", ranging from 0.80 to 0.96 in increments of 0.02.
* **Legend (Right Side):**
* Light Blue: λ = 1.5, μ = 2
* Blue: λ = 1, μ = 3
* Dark Blue: λ = 0.7, μ = 3
* Magenta: K = 16
* Gray: K = 4
* Black: K = 2
### Detailed Analysis
**Data Series Trends and Values:**
1. **λ = 1.5, μ = 2 (Light Blue):**
* Trend: Initially increases rapidly, peaks around t = 0.75 at Acc_test ≈ 0.95, then gradually decreases.
* Approximate Values:
* t = 0.0, Acc_test ≈ 0.80
* t = 0.75, Acc_test ≈ 0.95
* t = 2.0, Acc_test ≈ 0.88
2. **λ = 1, μ = 3 (Blue):**
* Trend: Increases rapidly, peaks around t = 0.5 at Acc_test ≈ 0.91, then decreases.
* Approximate Values:
* t = 0.0, Acc_test ≈ 0.80
* t = 0.5, Acc_test ≈ 0.91
* t = 2.0, Acc_test ≈ 0.82
3. **λ = 0.7, μ = 3 (Dark Blue):**
* Trend: Increases rapidly, peaks around t = 0.5 at Acc_test ≈ 0.86, then decreases.
* Approximate Values:
* t = 0.0, Acc_test ≈ 0.80
* t = 0.5, Acc_test ≈ 0.86
* t = 2.0, Acc_test ≈ 0.79
4. **K = 16 (Magenta):**
* Trend: Increases rapidly, peaks around t = 0.75 at Acc_test ≈ 0.94, then decreases.
* Approximate Values:
* t = 0.0, Acc_test ≈ 0.80
* t = 0.75, Acc_test ≈ 0.94
* t = 2.0, Acc_test ≈ 0.83
5. **K = 4 (Gray):**
* Trend: Increases rapidly, peaks around t = 0.5 at Acc_test ≈ 0.90, then decreases.
* Approximate Values:
* t = 0.0, Acc_test ≈ 0.80
* t = 0.5, Acc_test ≈ 0.90
* t = 2.0, Acc_test ≈ 0.80
6. **K = 2 (Black):**
* Trend: Increases rapidly, peaks around t = 0.5 at Acc_test ≈ 0.86, then decreases.
* Approximate Values:
* t = 0.0, Acc_test ≈ 0.80
* t = 0.5, Acc_test ≈ 0.86
* t = 2.0, Acc_test ≈ 0.79
### Key Observations
* All lines start at approximately the same accuracy (Acc_test ≈ 0.80) at t = 0.0.
* All lines show an initial increase in accuracy, followed by a decrease.
* The parameter settings λ = 1.5, μ = 2 (light blue) and K = 16 (magenta) achieve the highest peak accuracy.
* The parameter settings λ = 0.7, μ = 3 (dark blue) and K = 2 (black) achieve the lowest peak accuracy.
* The peak accuracy occurs between t = 0.5 and t = 0.75 for all parameter settings.
### Interpretation
The chart illustrates how different parameter settings affect the test accuracy of a model over time. The initial increase in accuracy suggests a learning phase, while the subsequent decrease indicates potential overfitting or a decline in performance as time progresses. The optimal parameter settings, as indicated by the highest peak accuracy, are λ = 1.5, μ = 2 and K = 16. These settings allow the model to achieve the best balance between learning and generalization. The parameters λ = 0.7, μ = 3 and K = 2 appear to be less effective, resulting in lower peak accuracy. The chart suggests that there is an optimal time window (around t = 0.5 to 0.75) for achieving the best accuracy, after which the model's performance may degrade.