\n
## Bar Chart: Token Type Distribution by Average Accuracy
### Overview
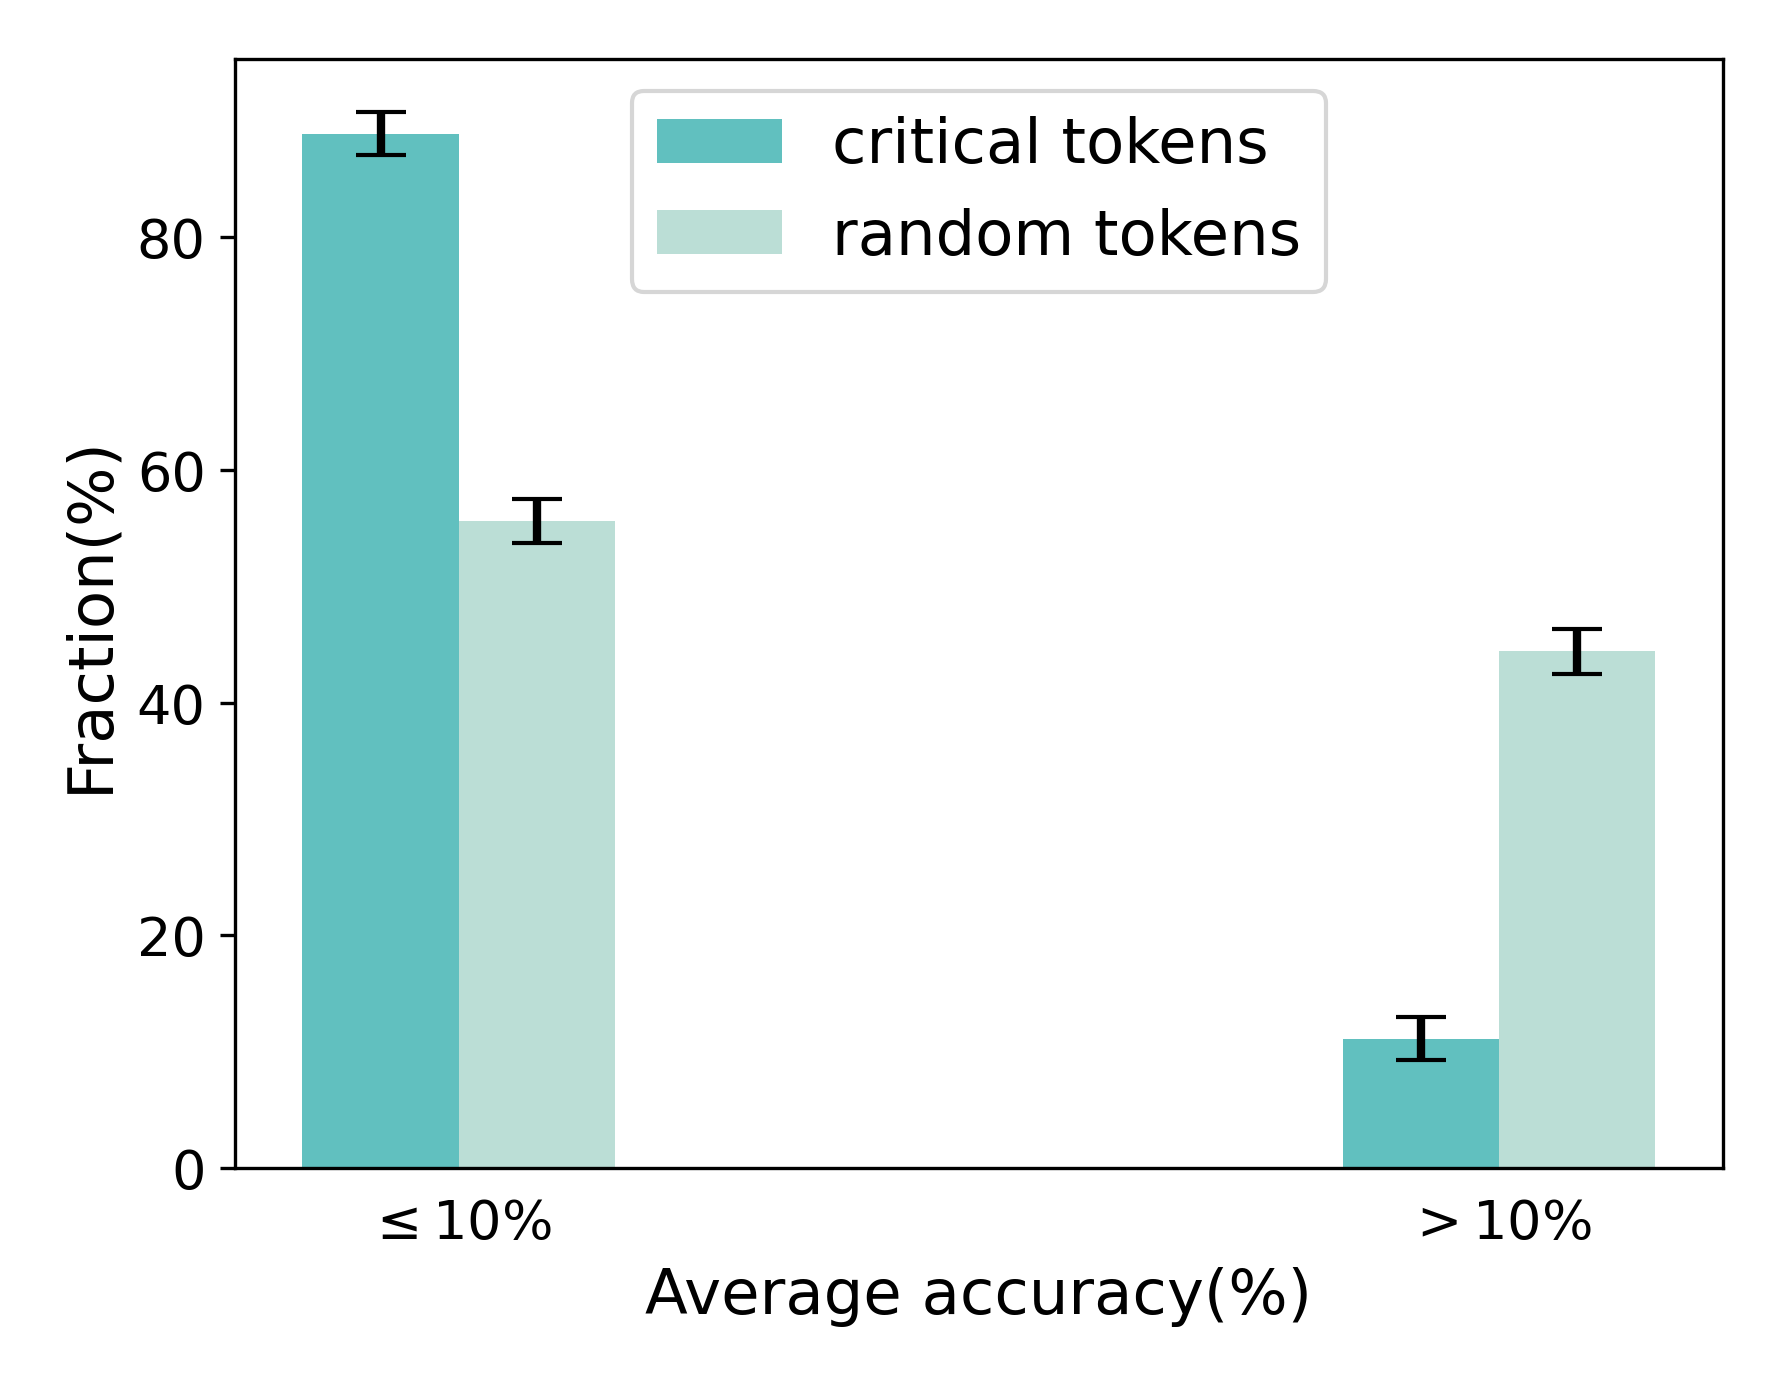
This is a grouped bar chart with error bars, comparing the fractional distribution of two token types—"critical tokens" and "random tokens"—across two categories of average accuracy. The chart visually demonstrates how the prevalence of each token type changes depending on whether the average accuracy is low (≤ 10%) or high (> 10%).
### Components/Axes
* **Chart Type:** Grouped bar chart with error bars.
* **X-Axis (Horizontal):** Labeled **"Average accuracy(%)"**. It has two categorical groups:
1. **"≤ 10%"** (Left group)
2. **"> 10%"** (Right group)
* **Y-Axis (Vertical):** Labeled **"Fraction(%)"**. The scale runs from 0 to 80, with major tick marks at 0, 20, 40, 60, and 80.
* **Legend:** Located in the top-center area of the chart.
* **Teal square:** Labeled **"critical tokens"**.
* **Light teal square:** Labeled **"random tokens"**.
* **Data Series:** Two series are plotted for each x-axis category.
* **Series 1 (Teal):** Represents "critical tokens".
* **Series 2 (Light Teal):** Represents "random tokens".
* **Error Bars:** Each bar has a black, vertical error bar (I-beam style) extending from its top, indicating variability or confidence intervals around the measured fraction.
### Detailed Analysis
**Category 1: Average accuracy ≤ 10%**
* **Critical Tokens (Teal Bar):** This is the tallest bar in the chart. Its top aligns with approximately **88%** on the y-axis. The error bar extends roughly from 86% to 90%.
* **Random Tokens (Light Teal Bar):** This bar is significantly shorter. Its top aligns with approximately **56%** on the y-axis. The error bar extends roughly from 54% to 58%.
**Category 2: Average accuracy > 10%**
* **Critical Tokens (Teal Bar):** This is the shortest bar in the chart. Its top aligns with approximately **11%** on the y-axis. The error bar extends roughly from 9% to 13%.
* **Random Tokens (Light Teal Bar):** This bar is taller than its counterpart in the same group. Its top aligns with approximately **44%** on the y-axis. The error bar extends roughly from 42% to 46%.
### Key Observations
1. **Inverse Relationship:** There is a stark inverse relationship between the two token types across the accuracy categories. "Critical tokens" dominate the low-accuracy (≤ 10%) group but are minimal in the high-accuracy (> 10%) group. The opposite is true for "random tokens."
2. **Magnitude of Difference:** The difference in fraction between critical and random tokens is much larger in the low-accuracy group (~32 percentage points) than in the high-accuracy group (~33 percentage points, but in the opposite direction).
3. **Error Bar Consistency:** The error bars are relatively small compared to the bar heights, suggesting the measured fractions have moderate precision. The error ranges for the two token types within each category do not overlap, indicating the differences are likely statistically significant.
### Interpretation
The data suggests a strong correlation between token type and model accuracy performance. "Critical tokens" are overwhelmingly associated with scenarios where the average accuracy is very low (≤ 10%). This could imply that when a model is performing poorly, its outputs or internal states are heavily influenced by these "critical" tokens. Conversely, in higher accuracy regimes (> 10%), the presence of "critical tokens" drops dramatically, while "random tokens" become more prevalent.
This pattern might indicate that "critical tokens" are markers of failure modes or specific types of errors, whereas "random tokens" are more characteristic of a model's baseline or successful operation. The chart effectively argues that analyzing the composition of tokens (critical vs. random) can serve as a diagnostic tool for understanding model accuracy. The clear separation between the groups underscores that these two token categories behave fundamentally differently across the accuracy spectrum.