# Technical Document Extraction: Weight Packing and Unpacking Latency Analysis
This image contains a technical diagram illustrating a data reordering and unpacking process for neural network weights, accompanied by a bar chart comparing latency performance.
## 1. Component Isolation: Data Flow Diagram (Left and Center)
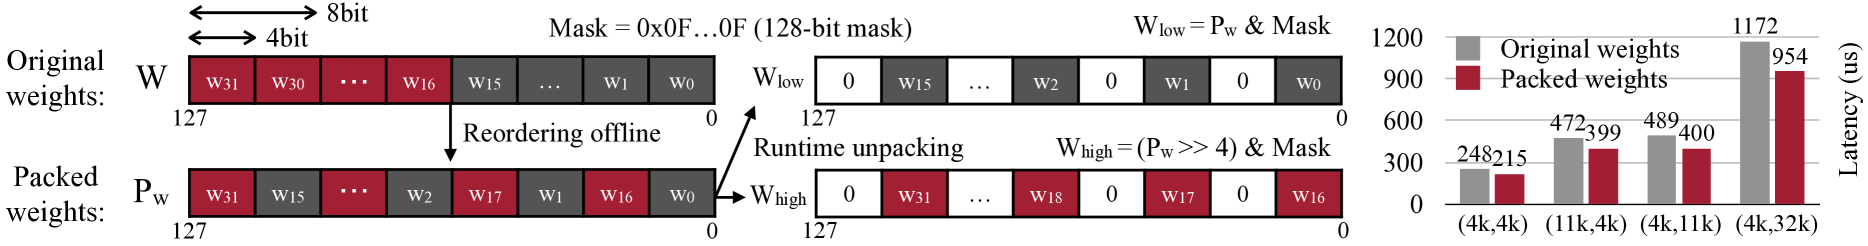
The diagram illustrates the transformation of 4-bit weights within a 128-bit register.
### Header / Metadata
- **Bit Width Indicators**:
- A double-headed arrow spans two blocks labeled **"8bit"**.
- A double-headed arrow spans one block labeled **"4bit"**.
- **Mask Definition**: `Mask = 0x0F...0F (128-bit mask)`
### Stage 1: Original Weights (W)
- **Label**: `Original weights: W`
- **Structure**: A 128-bit register indexed from `127` (left) to `0` (right).
- **Content**:
- High bits (red blocks): $W_{31}, W_{30}, \dots, W_{16}$
- Low bits (grey blocks): $W_{15}, \dots, W_1, W_0$
- **Process**: An arrow points downward labeled **"Reordering offline"**.
### Stage 2: Packed Weights ($P_w$)
- **Label**: `Packed weights: P_w`
- **Structure**: A 128-bit register indexed from `127` to `0`.
- **Content**: The weights are interleaved.
- Sequence (left to right): $W_{31}$ (red), $W_{15}$ (grey), $\dots, W_2$ (red), $W_{17}$ (red), $W_1$ (grey), $W_{16}$ (red), $W_0$ (grey).
- **Process**: An arrow points to the right labeled **"Runtime unpacking"**.
### Stage 3: Unpacked Components ($W_{low}$ and $W_{high}$)
The packed register is split into two 128-bit registers using bitwise operations.
1. **Lower Component ($W_{low}$)**:
- **Formula**: $W_{low} = P_w \ \& \ Mask$
- **Structure**: Alternating zeroed blocks and grey weight blocks.
- **Content**: $[0, W_{15}, \dots, W_2, 0, W_1, 0, W_0]$
2. **Higher Component ($W_{high}$)**:
- **Formula**: $W_{high} = (P_w >> 4) \ \& \ Mask$
- **Structure**: Alternating zeroed blocks and red weight blocks.
- **Content**: $[0, W_{31}, \dots, W_{18}, 0, W_{17}, 0, W_{16}]$
---
## 2. Component Isolation: Latency Comparison Chart (Right)
A grouped bar chart comparing the latency of original weights versus packed weights across different matrix dimensions.
### Chart Metadata
- **Y-Axis Title**: Latency (us)
- **Y-Axis Scale**: 0 to 1200 (increments of 300)
- **X-Axis Categories**: Matrix dimensions $(M, K)$
- **Legend**:
- **Grey Square**: Original weights
- **Dark Red Square**: Packed weights
### Data Table Extraction
| Matrix Dimension (M, K) | Original Weights Latency (us) | Packed Weights Latency (us) | Visual Trend |
| :--- | :--- | :--- | :--- |
| (4k, 4k) | 248 | 215 | Packed is ~13% faster |
| (11k, 4k) | 472 | 399 | Packed is ~15% faster |
| (4k, 11k) | 489 | 400 | Packed is ~18% faster |
| (4k, 32k) | 1172 | 954 | Packed is ~18% faster |
### Trend Analysis
- **Consistency**: In every tested matrix dimension, the "Packed weights" (red bars) exhibit lower latency than the "Original weights" (grey bars).
- **Scaling**: As the matrix size increases (specifically the $K$ dimension from 4k to 32k), the absolute latency savings increase significantly, from 33us at (4k, 4k) to 218us at (4k, 32k).
- **Efficiency**: The data suggests that the "Runtime unpacking" method shown in the diagram provides a performance optimization over standard weight handling.