## Chart: Proportion of Flips vs. Iterations for Qwen2.5-14B
### Overview
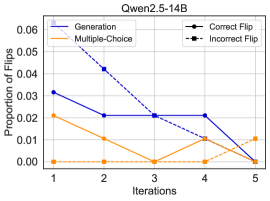
The image is a line chart comparing the proportion of flips (presumably in a model's output) across iterations for different methods: Generation, Multiple-Choice, Correct Flip, and Incorrect Flip. The x-axis represents iterations (1 to 5), and the y-axis represents the proportion of flips (0.00 to 0.06).
### Components/Axes
* **Title:** Qwen2.5-14B
* **X-axis:** Iterations (labeled 1, 2, 3, 4, 5)
* **Y-axis:** Proportion of Flips (labeled 0.00, 0.01, 0.02, 0.03, 0.04, 0.05, 0.06)
* **Legend:** Located in the top-left and top-right of the chart.
* **Generation:** Blue dashed line
* **Multiple-Choice:** Orange solid line
* **Correct Flip:** Black solid line with circle markers
* **Incorrect Flip:** Black dashed line with square markers
### Detailed Analysis
* **Generation (Blue dashed line):** Starts at approximately 0.032 at iteration 1, decreases to approximately 0.042 at iteration 2, decreases to approximately 0.021 at iteration 3, remains at approximately 0.021 at iteration 4, and decreases to approximately 0.00 at iteration 5. The trend is generally decreasing.
* **Multiple-Choice (Orange solid line):** Starts at approximately 0.021 at iteration 1, decreases to approximately 0.01 at iteration 2, decreases to approximately 0.00 at iteration 3, increases to approximately 0.01 at iteration 4, and decreases to approximately 0.01 at iteration 5. The trend is fluctuating, but generally low.
* **Correct Flip (Black solid line with circle markers):** Starts at approximately 0.032 at iteration 1, decreases to approximately 0.021 at iteration 2, remains at approximately 0.021 at iteration 3, increases to approximately 0.021 at iteration 4, and decreases to approximately 0.00 at iteration 5. The trend is decreasing.
* **Incorrect Flip (Black dashed line with square markers):** Starts at approximately 0.00 at iteration 1, remains at approximately 0.00 at iteration 2, remains at approximately 0.00 at iteration 3, increases to approximately 0.01 at iteration 4, and decreases to approximately 0.01 at iteration 5. The trend is generally low, with a slight increase at iteration 4.
### Key Observations
* The "Generation" method shows a decreasing proportion of flips as iterations increase.
* The "Multiple-Choice" method has a consistently low proportion of flips across all iterations.
* The "Correct Flip" method shows a decreasing proportion of flips as iterations increase.
* The "Incorrect Flip" method has a very low proportion of flips, with a slight increase at iteration 4.
### Interpretation
The chart suggests that the "Generation" and "Correct Flip" methods become more stable (fewer flips) as the model iterates. The "Multiple-Choice" method consistently maintains a low proportion of flips, indicating a stable performance. The "Incorrect Flip" method remains low, suggesting that incorrect flips are rare. The data implies that the model's performance improves with iterations, particularly for the "Generation" and "Correct Flip" methods. The slight increase in "Incorrect Flip" at iteration 4 could be an anomaly or a point of interest for further investigation.