## Line Chart: Qwen2.5-14B - Proportion of Flips vs. Iterations
### Overview
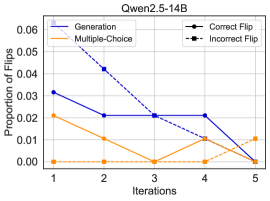
This chart displays the proportion of flips (likely referring to model parameter updates or changes) over five iterations for a model named Qwen2.5-14B. The chart compares different methods: Generation, Multiple-Choice, Correct Flip, and Incorrect Flip. The y-axis represents the "Proportion of Flips" and the x-axis represents "Iterations".
### Components/Axes
* **Title:** Qwen2.5-14B (top-center)
* **X-axis Label:** Iterations (bottom-center)
* Axis Markers: 1, 2, 3, 4, 5
* **Y-axis Label:** Proportion of Flips (left-center)
* Axis Scale: 0.00 to 0.06 (approximately)
* **Legend:** Located in the top-right corner.
* Generation: Solid Blue Line
* Multiple-Choice: Solid Orange Line
* Correct Flip: Black Line with Circle Markers
* Incorrect Flip: Black Dashed Line with Circle Markers
### Detailed Analysis
* **Generation (Solid Blue Line):** The line slopes downward overall.
* Iteration 1: Approximately 0.032
* Iteration 2: Approximately 0.043
* Iteration 3: Approximately 0.022
* Iteration 4: Approximately 0.021
* Iteration 5: Approximately 0.018
* **Multiple-Choice (Solid Orange Line):** The line generally slopes downward, with a slight increase at Iteration 4.
* Iteration 1: Approximately 0.022
* Iteration 2: Approximately 0.009
* Iteration 3: Approximately 0.007
* Iteration 4: Approximately 0.011
* Iteration 5: Approximately 0.002
* **Correct Flip (Black Line with Circle Markers):** The line is relatively flat, with some fluctuation.
* Iteration 1: Approximately 0.002
* Iteration 2: Approximately 0.042
* Iteration 3: Approximately 0.022
* Iteration 4: Approximately 0.010
* Iteration 5: Approximately 0.002
* **Incorrect Flip (Black Dashed Line with Circle Markers):** The line slopes downward.
* Iteration 1: Approximately 0.001
* Iteration 2: Approximately 0.003
* Iteration 3: Approximately 0.002
* Iteration 4: Approximately 0.001
* Iteration 5: Approximately 0.000
### Key Observations
* The "Generation" method starts with the highest proportion of flips and decreases steadily over iterations.
* The "Multiple-Choice" method has a lower initial proportion of flips and shows a more erratic decrease.
* "Correct Flip" shows a large spike at iteration 2, then decreases.
* "Incorrect Flip" consistently has the lowest proportion of flips throughout all iterations.
* All methods show a decreasing trend in the proportion of flips as iterations progress.
### Interpretation
The data suggests that the Qwen2.5-14B model is becoming more stable or converging as iterations increase, as indicated by the decreasing proportion of flips across all methods. The "Generation" method appears to be undergoing the most significant changes initially, while the "Incorrect Flip" method remains relatively stable. The spike in "Correct Flip" at iteration 2 could indicate a period of significant learning or adjustment. The overall downward trend suggests that the model is refining its parameters and reducing the frequency of changes needed to improve performance. The different methods likely represent different training or evaluation strategies, and their varying flip proportions could reflect their effectiveness in guiding the model towards optimal performance. The chart provides insight into the model's learning process and the impact of different methods on its parameter updates.