## Line Chart: Qwen2.5-14B Flip Proportions Over Iterations
### Overview
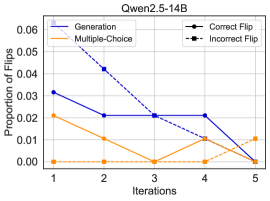
This is a line chart titled "Qwen2.5-14B" that plots the "Proportion of Flips" against "Iterations" (from 1 to 5). It compares two primary methods, "Generation" and "Multiple-Choice," and also tracks two specific flip outcomes, "Correct Flip" and "Incorrect Flip," across the iterative process. The chart uses distinct line styles and colors to differentiate the four data series.
### Components/Axes
* **Chart Title:** "Qwen2.5-14B" (located at the top center).
* **Y-Axis:**
* **Label:** "Proportion of Flips"
* **Scale:** Linear, ranging from 0.00 to 0.06, with major tick marks at 0.00, 0.01, 0.02, 0.03, 0.04, 0.05, and 0.06.
* **X-Axis:**
* **Label:** "Iterations"
* **Scale:** Discrete, with integer values from 1 to 5.
* **Legend:** Positioned in the top-left corner of the plot area. It contains four entries:
1. **Generation:** Solid blue line.
2. **Multiple-Choice:** Solid orange line.
3. **Correct Flip:** Dashed blue line with circular markers.
4. **Incorrect Flip:** Dashed orange line with square markers.
### Detailed Analysis
**Data Series Trends and Approximate Values:**
1. **Generation (Solid Blue Line):**
* **Trend:** Shows a steady, stepwise decline over the iterations.
* **Values:**
* Iteration 1: ~0.030
* Iteration 2: ~0.020
* Iteration 3: ~0.020
* Iteration 4: ~0.020
* Iteration 5: ~0.000
2. **Multiple-Choice (Solid Orange Line):**
* **Trend:** Decreases initially, reaches a minimum at iteration 3, then shows a slight recovery.
* **Values:**
* Iteration 1: ~0.020
* Iteration 2: ~0.010
* Iteration 3: ~0.000
* Iteration 4: ~0.010
* Iteration 5: ~0.015
3. **Correct Flip (Dashed Blue Line with Circles):**
* **Trend:** Exhibits a sharp, consistent downward trend, converging to zero.
* **Values:**
* Iteration 1: ~0.060
* Iteration 2: ~0.040
* Iteration 3: ~0.020
* Iteration 4: ~0.020
* Iteration 5: ~0.000
4. **Incorrect Flip (Dashed Orange Line with Squares):**
* **Trend:** Remains at or near zero for the first four iterations, then shows a sudden increase at the final iteration.
* **Values:**
* Iteration 1: ~0.000
* Iteration 2: ~0.000
* Iteration 3: ~0.000
* Iteration 4: ~0.000
* Iteration 5: ~0.010
### Key Observations
* **Dominant Trend:** The "Correct Flip" proportion starts as the highest value (0.06) and decreases most dramatically, suggesting a strong initial correction mechanism that diminishes over time.
* **Convergence:** Both the "Generation" and "Correct Flip" series converge to 0.00 by the fifth iteration.
* **Late Anomaly:** The "Incorrect Flip" series is flat until iteration 5, where it spikes to ~0.01. This is the only series that increases at the final step.
* **Method Comparison:** The "Multiple-Choice" method ends with a higher flip proportion (~0.015) than the "Generation" method (~0.000) at iteration 5.
* **Relationship:** The "Correct Flip" line (dashed blue) consistently sits above the "Generation" line (solid blue) for the first four iterations, indicating that the proportion of correct flips is higher than the overall generation flip proportion during that period.
### Interpretation
The chart likely illustrates the performance of the Qwen2.5-14B model across iterative refinement or evaluation steps. The "Proportion of Flips" probably refers to the rate at which the model changes its output (a "flip") from one iteration to the next.
* **Learning/Refinement Curve:** The steep decline in "Correct Flip" suggests the model makes many beneficial corrections early on, but these become less frequent as it stabilizes. The overall decline in flip rates for both "Generation" and "Correct Flip" indicates the model's outputs are becoming more consistent and confident over iterations.
* **Emergence of Errors:** The sudden appearance of "Incorrect Flip" at iteration 5 is a critical observation. It implies that after a period of stable or improving performance, a new type of error or instability emerges. This could be due to over-optimization, encountering a difficult edge case, or a breakdown in the iterative process.
* **Methodological Difference:** The "Multiple-Choice" method shows a different pattern, with a dip and partial recovery. Its final value being higher than "Generation" suggests that this method may be more prone to late-stage changes or instability compared to the standard generation approach.
* **Overall Narrative:** The data tells a story of initial high activity (many correct flips), leading to convergence and stability, followed by a potential failure mode (incorrect flips) in the final step. This highlights the importance of monitoring not just the rate of change, but the *quality* of changes throughout an iterative process.