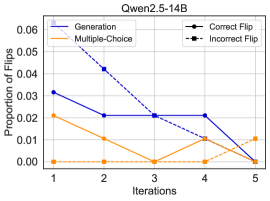
## Line Chart: Proportion of Flips Across Iterations for Qwen2.5-14B
### Overview
The chart illustrates the proportion of "flips" (likely model output changes) across 5 iterations for two categories: "Generation" (blue line) and "Multiple-Choice" (orange line). The y-axis represents the proportion of flips (0.00 to 0.06), and the x-axis represents iterations (1 to 5). A legend distinguishes "Correct Flip" (solid black) and "Incorrect Flip" (dashed black), though these are not visually represented in the chart.
---
### Components/Axes
- **Title**: "Qwen2.5-14B" (top center).
- **Y-Axis**: "Proportion of Flips" (0.00 to 0.06, linear scale).
- **X-Axis**: "Iterations" (1 to 5, discrete steps).
- **Legend**:
- **Generation**: Blue solid line.
- **Multiple-Choice**: Orange solid line.
- **Correct Flip**: Solid black (not visible in the chart).
- **Incorrect Flip**: Dashed black (not visible in the chart).
---
### Detailed Analysis
#### Generation (Blue Line)
- **Iteration 1**: ~0.03 (blue dot).
- **Iteration 2**: ~0.04 (blue dot).
- **Iteration 3**: ~0.02 (blue dot).
- **Iteration 4**: ~0.01 (blue dot).
- **Iteration 5**: ~0.00 (blue dot).
- **Trend**: Steady decline from 0.03 to 0.00 over 5 iterations.
#### Multiple-Choice (Orange Line)
- **Iteration 1**: ~0.02 (orange dot).
- **Iteration 2**: ~0.01 (orange dot).
- **Iteration 3**: ~0.00 (orange dot).
- **Iteration 4**: ~0.01 (orange dot).
- **Iteration 5**: ~0.01 (orange dot).
- **Trend**: Initial drop to 0.00 at iteration 3, followed by a slight increase to 0.01 at iterations 4 and 5.
---
### Key Observations
1. **Generation Line**: Shows a consistent downward trend, suggesting a reduction in flip proportion as iterations increase.
2. **Multiple-Choice Line**: Exhibits a non-linear pattern, with a sharp drop at iteration 3 and a rebound in later iterations.
3. **Legend Discrepancy**: The "Correct Flip" and "Incorrect Flip" labels in the legend do not correspond to any visible data series in the chart. This may indicate a mislabeling or omission in the image.
---
### Interpretation
The chart suggests that the "Generation" model experiences a significant reduction in flip proportion over iterations, potentially indicating improved stability or accuracy. The "Multiple-Choice" model shows more variability, with a temporary dip and subsequent recovery. The absence of "Correct Flip" and "Incorrect Flip" data in the chart raises questions about the completeness of the visualization or potential errors in the legend. The trends imply that iterative refinement may enhance model performance, but further clarification on the "Correct/Incorrect Flip" categories is needed for a comprehensive analysis.