## Pie Charts: Dataset Response Distribution
### Overview
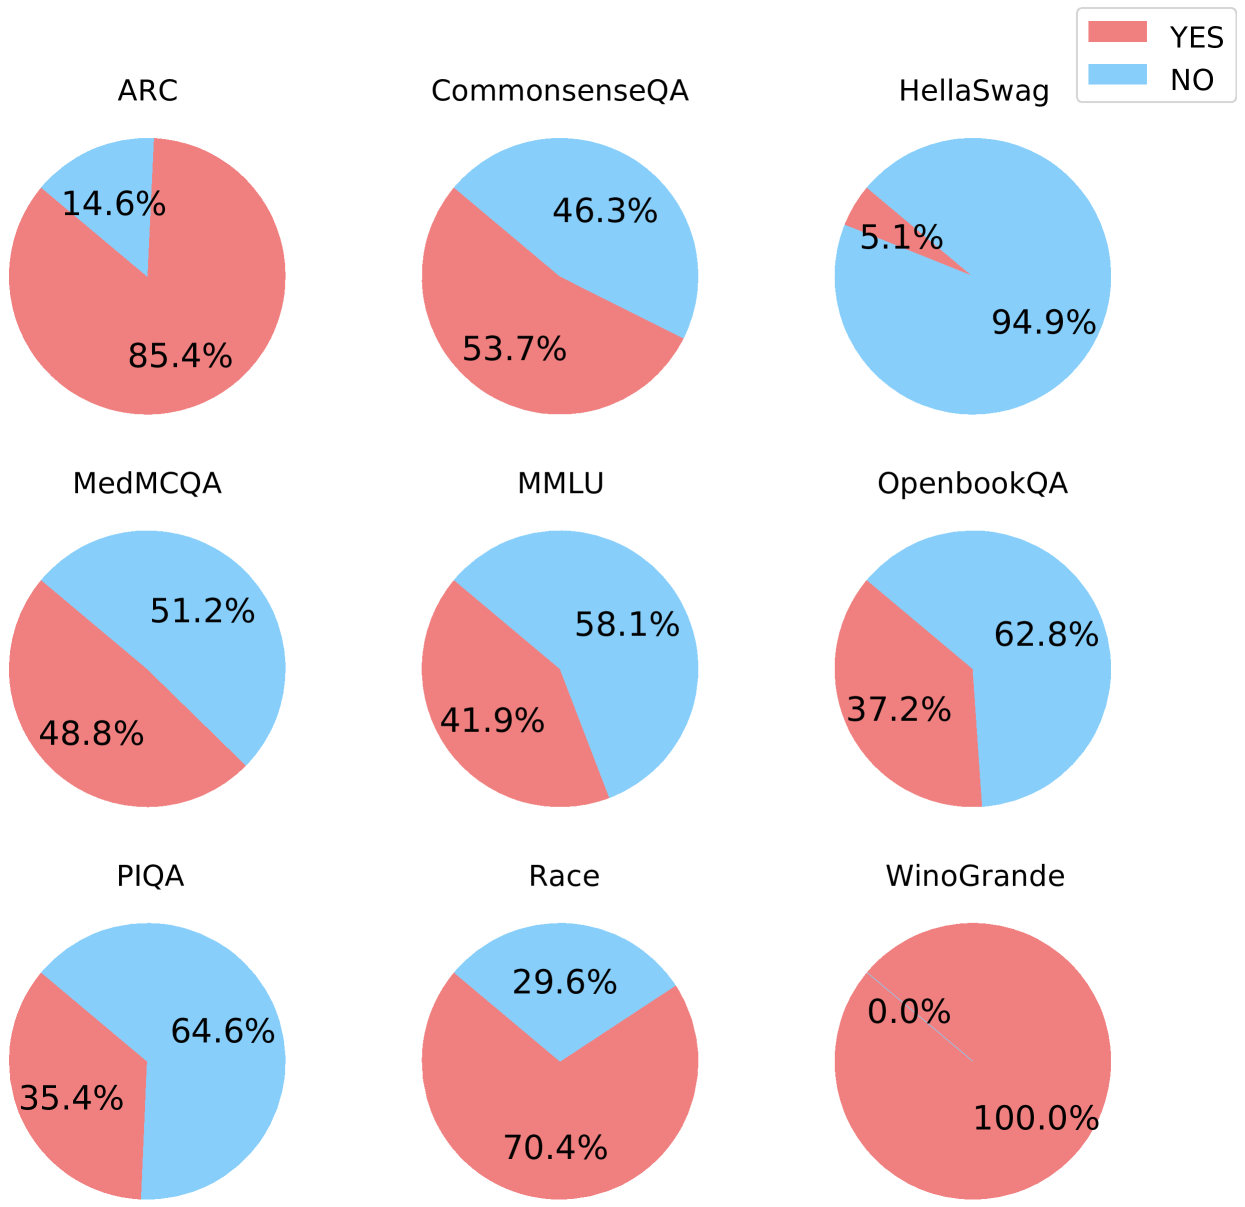
The image displays nine pie charts comparing response distributions (YES/NO) across different datasets. Each chart uses a red/blue color scheme (legend: red = YES, blue = NO) to represent agreement/disagreement rates.
### Components/Axes
- **Legend**: Located in the top-right corner, with red labeled "YES" and blue labeled "NO".
- **Pie Charts**: Nine circular charts arranged in a 3x3 grid, each labeled with a dataset name (e.g., ARC, CommonsenseQA).
- **Percentages**: Each segment of the pie charts includes numerical values (e.g., "85.4%", "14.6%").
### Detailed Analysis
1. **ARC**: 85.4% YES (red), 14.6% NO (blue).
2. **CommonsenseQA**: 53.7% YES, 46.3% NO.
3. **HellaSwag**: 5.1% YES, 94.9% NO.
4. **MedMCQA**: 48.8% YES, 51.2% NO.
5. **MMLU**: 41.9% YES, 58.1% NO.
6. **OpenbookQA**: 37.2% YES, 62.8% NO.
7. **PIQA**: 35.4% YES, 64.6% NO.
8. **Race**: 70.4% YES, 29.6% NO.
9. **WinoGrande**: 100.0% YES, 0.0% NO.
### Key Observations
- **WinoGrande** is the only dataset with 100% YES responses, indicating unanimous agreement.
- **HellaSwag** has the highest NO response rate (94.9%), suggesting strong disagreement.
- **OpenbookQA** and **PIQA** show significant NO majorities (>60%).
- **ARC** and **Race** have the highest YES majorities (>70%).
- **CommonsenseQA** and **MedMCQA** are nearly balanced (~50% YES/NO).
### Interpretation
The data suggests varying levels of consensus or correctness across datasets. WinoGrande’s 100% YES response implies near-perfect agreement, possibly due to unambiguous questions or high model confidence. Conversely, HellaSwag’s 94.9% NO response may reflect inherent ambiguity or challenging questions. Datasets like OpenbookQA and PIQA show lower YES rates, indicating potential difficulties in model performance or interpretability. The near-even splits in CommonsenseQA and MedMCQA highlight datasets where responses are polarized, possibly due to subjective or complex queries. These trends could inform dataset design or model training strategies to address specific weaknesses.