## Microscopic Observations: Cell Structures
### Overview
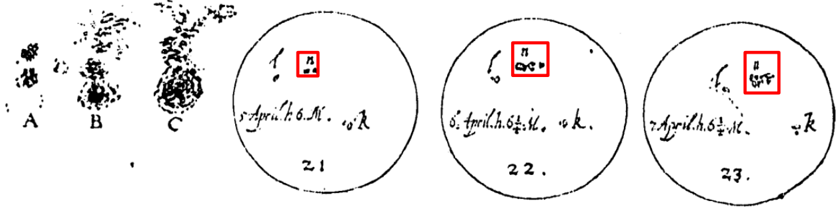
The image presents a series of sketches depicting cell structures, likely observed under a microscope. The sketches are arranged horizontally, with three detailed cell clusters on the left, labeled A, B, and C, followed by three circular diagrams on the right, labeled 21, 22, and 23, each containing internal details and annotations.
### Components/Axes
* **Left Side:** Three cell cluster diagrams labeled A, B, and C.
* **Right Side:** Three circular diagrams labeled 21, 22, and 23. Each circle contains internal details and handwritten annotations.
* **Annotations:** Each circular diagram includes handwritten text, including dates and possibly observational notes. The text appears to be in a historical script.
### Detailed Analysis
**Left Side: Cell Clusters**
* **A:** A small cluster of cells, appearing less dense than the others.
* **B:** A more defined cluster, with cells appearing more connected.
* **C:** The densest cluster, with cells forming a complex structure.
**Right Side: Circular Diagrams**
* **Diagram 21:**
* Text: "5. April.h.6.M. .oK"
* A small cluster of dots and lines is present in the upper region of the circle.
* A red box highlights the symbol "n" with two dots below it.
* **Diagram 22:**
* Text: "6. April.h.6 1/2. .oK."
* A small cluster of dots and lines is present in the upper region of the circle.
* A red box highlights the symbol "n" with two dots below it.
* **Diagram 23:**
* Text: "7. April.h.6 1/2. .oK"
* A small cluster of dots and lines is present in the upper region of the circle.
* A red box highlights the symbol "SHE"
### Key Observations
* The cell clusters (A, B, C) show increasing complexity and density.
* The circular diagrams (21, 22, 23) appear to represent observations made on consecutive days in April.
* The handwritten annotations include time stamps and possibly observer initials.
* The red boxes highlight specific symbols or regions of interest within the diagrams.
### Interpretation
The image likely represents a series of microscopic observations of cell structures over a three-day period. The increasing complexity of the cell clusters (A, B, C) might indicate a developmental process or different stages of cell aggregation. The circular diagrams (21, 22, 23) provide a more detailed view of specific cells or regions, with the annotations offering contextual information about the time and conditions of the observations. The red boxes highlight specific features that the observer found noteworthy, possibly related to cell morphology or behavior. The consistency of the time stamps (around 6 AM) suggests a systematic approach to data collection. The symbols "n" and "SHE" are likely labels or identifiers used by the observer to categorize or track specific cell types or structures.