## Diagram: Sequential Process with Symbolic Notations
### Overview
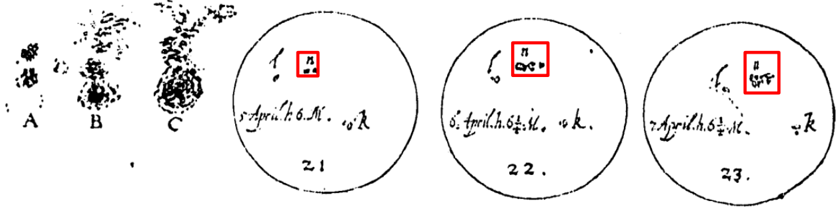
The image depicts three circular diagrams labeled **21**, **22**, and **23**, each containing handwritten text, a red-boxed symbol, and a timestamp. To the left, three abstract sketches labeled **A**, **B**, and **C** show progressive complexity. The diagrams and sketches suggest a stepwise process or timeline, with annotations likely representing data points or status markers.
### Components/Axes
- **Circles (21, 22, 23)**:
- Each circle contains:
- Handwritten text (e.g., "5 April 6 M.", "6 April 6 M.").
- A red-boxed symbol (e.g., "n" with a line, "qc" with a checkmark, "gfr" with a checkmark).
- A timestamp at the bottom (e.g., "21", "22", "23").
- **Sketches (A, B, C)**:
- Abstract, non-numeric representations of increasing complexity.
- **Red Boxes**:
- Symbols with annotations (e.g., "n", "qc", "gfr") and checkmarks or lines.
### Detailed Analysis
1. **Circle 21**:
- Text: "5 April 6 M." (likely a timestamp: April 5, 6:00 AM).
- Red box: Symbol "n" with a horizontal line.
- Timestamp: "21".
2. **Circle 22**:
- Text: "6 April 6 M." (April 6, 6:00 AM).
- Red box: Symbol "qc" with a checkmark.
- Timestamp: "22".
3. **Circle 23**:
- Text: "7 April 6 M." (April 7, 6:00 AM).
- Red box: Symbol "gfr" with a checkmark.
- Timestamp: "23".
4. **Sketches A, B, C**:
- **A**: Simple, fragmented shapes.
- **B**: More defined, clustered forms.
- **C**: Complex, dense aggregation.
- Likely represent stages of a process (e.g., data aggregation, analysis).
### Key Observations
- **Temporal Progression**: The timestamps (21, 22, 23) and dates (April 5–7) suggest a sequential timeline.
- **Symbolic Notations**:
- "n" (possibly "no" or "negative") with a line in Circle 21.
- "qc" (quality control) with a checkmark in Circle 22.
- "gfr" (possibly "good for release") with a checkmark in Circle 23.
- **Spatial Relationships**:
- Sketches A–C precede the circles, implying a conceptual-to-execution flow.
- Red boxes are consistently positioned in the upper-right quadrant of each circle.
### Interpretation
The diagrams likely document a quality control or approval process over three days (April 5–7). The red-boxed symbols denote status changes:
- **Circle 21**: Initial negative or neutral status ("n").
- **Circle 22**: Quality control check passed ("qc").
- **Circle 23**: Final approval ("gfr").
The sketches A–C may represent raw data or conceptual models that evolve into the structured diagrams. The consistent timestamp format ("6 M.") suggests automated logging, while the handwritten text implies manual annotations.
### Uncertainties
- Symbol meanings (e.g., "gfr") are inferred from context.
- The exact relationship between sketches A–C and the circles is speculative but suggests a workflow.
**Note**: The image contains no explicit numerical data beyond timestamps and labels. Symbolic interpretations are based on visual patterns and contextual clues.