## Line Graph: Surprisal vs Training Steps
### Overview
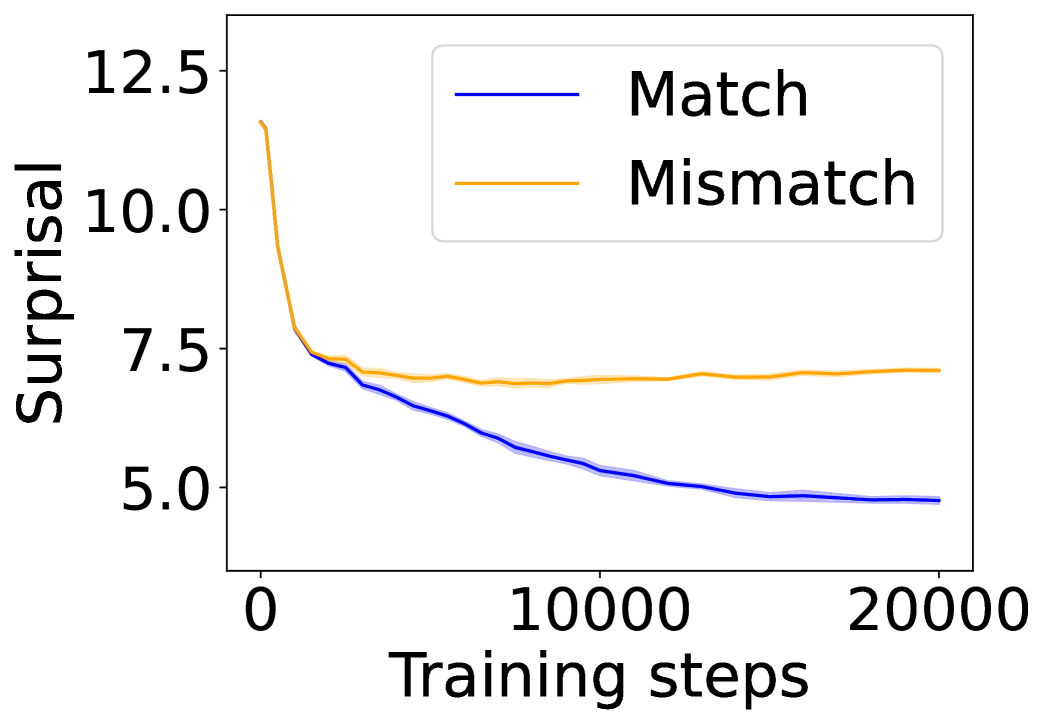
The image depicts a line graph comparing two data series ("Match" and "Mismatch") across 20,000 training steps. The y-axis measures "Surprisal" (log probability), while the x-axis represents training progression. Two distinct trends emerge: a sharp decline in "Match" surprisal followed by stabilization, and a gradual decline in "Mismatch" surprisal with minimal variability.
### Components/Axes
- **Y-axis**: "Surprisal" (log probability), scaled from 5.0 to 12.5 in increments of 2.5
- **X-axis**: "Training steps" (0 to 20,000), marked at 0, 10,000, and 20,000
- **Legend**:
- Blue line: "Match"
- Orange line: "Mismatch"
- **Placement**: Legend positioned in the top-right quadrant of the plot area
### Detailed Analysis
1. **Match (Blue Line)**:
- Initial value: ~12.5 at 0 steps
- Sharp decline to ~7.5 by ~2,500 steps
- Gradual decrease to ~5.0 by 20,000 steps
- Variability: ±0.2 around the trendline
2. **Mismatch (Orange Line)**:
- Initial value: ~10.0 at 0 steps
- Steady decline to ~7.5 by ~10,000 steps
- Minimal change after 10,000 steps (~7.5–7.7)
- Variability: ±0.1 around the trendline
### Key Observations
- **Convergence**: Both lines converge near 7.5 surprisal by 10,000 steps
- **Rate of Change**: "Match" shows a steeper initial decline (Δ~5.0 over 2,500 steps) vs "Mismatch" (Δ~2.5 over 10,000 steps)
- **Stability**: "Mismatch" demonstrates lower variance (±0.1) compared to "Match" (±0.2)
### Interpretation
The data suggests differential learning dynamics between matched and mismatched conditions:
1. **Match Condition**: Rapid initial reduction in surprisal indicates effective pattern recognition/learning, with diminishing returns after 2,500 steps
2. **Mismatch Condition**: Slower, more stable decline suggests either:
- Inherent difficulty in learning mismatched patterns
- Different optimization landscape characteristics
3. **Convergence Point**: Both conditions reach similar surprisal levels by 10,000 steps, implying comparable asymptotic performance despite divergent learning trajectories
The graph highlights the importance of data alignment in training efficiency, with matched conditions achieving faster initial learning but both approaches eventually reaching similar performance ceilings.