\n
## Line Chart: Surprisal vs. Training Steps
### Overview
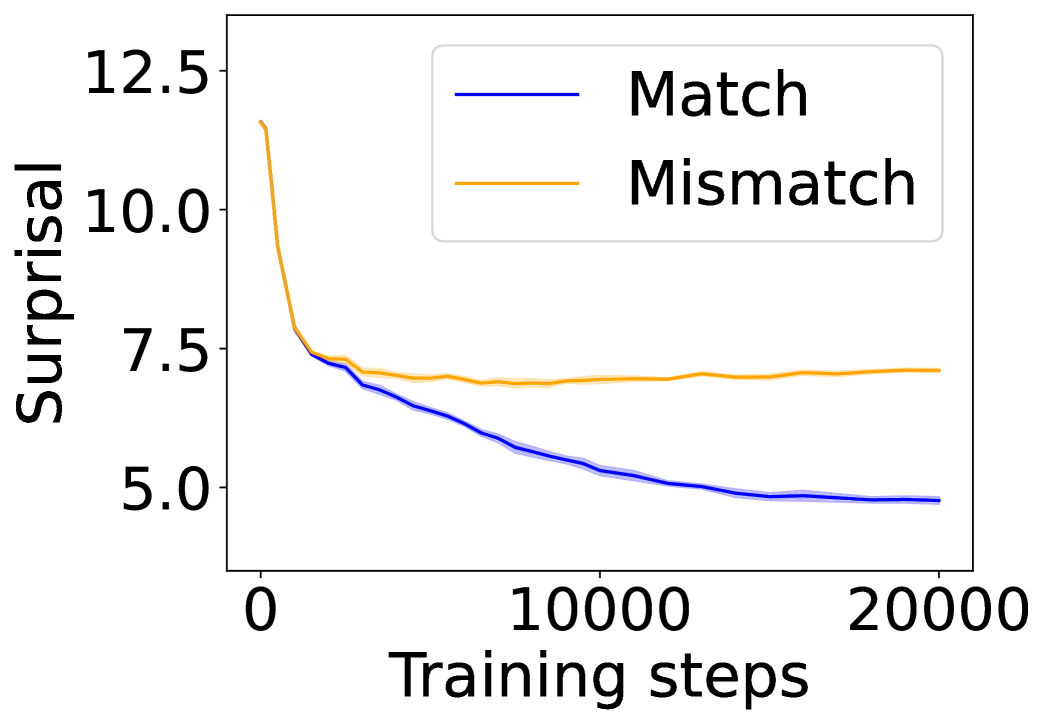
The image presents a line chart illustrating the relationship between "Surprisal" (y-axis) and "Training steps" (x-axis). Two data series are plotted: one representing "Match" and the other "Mismatch" conditions. The chart appears to track the evolution of surprisal during a training process.
### Components/Axes
* **X-axis:** "Training steps", ranging from approximately 0 to 20000. The axis is linearly scaled.
* **Y-axis:** "Surprisal", ranging from approximately 4.5 to 12.5. The axis is linearly scaled.
* **Legend:** Located in the top-right corner of the chart.
* "Match" - represented by a dark blue line.
* "Mismatch" - represented by a light orange line.
### Detailed Analysis
The "Match" line (dark blue) starts at approximately 5.2 and exhibits a generally decreasing trend, leveling off around a surprisal value of 4.8 at 20000 training steps. The initial slope is steep, but it gradually becomes flatter as training progresses.
The "Mismatch" line (light orange) begins at approximately 11.0 and also shows a decreasing trend, but it plateaus at a higher surprisal value than the "Match" line, around 6.8 at 20000 training steps. The initial decrease is rapid, but the line fluctuates more than the "Match" line, indicating greater variability.
Here's a breakdown of approximate data points:
**Match (Dark Blue):**
* 0 Training Steps: ~5.2 Surprisal
* 2000 Training Steps: ~4.9 Surprisal
* 4000 Training Steps: ~4.7 Surprisal
* 6000 Training Steps: ~4.6 Surprisal
* 8000 Training Steps: ~4.5 Surprisal
* 10000 Training Steps: ~4.4 Surprisal
* 12000 Training Steps: ~4.3 Surprisal
* 14000 Training Steps: ~4.2 Surprisal
* 16000 Training Steps: ~4.1 Surprisal
* 18000 Training Steps: ~4.0 Surprisal
* 20000 Training Steps: ~4.8 Surprisal
**Mismatch (Light Orange):**
* 0 Training Steps: ~11.0 Surprisal
* 2000 Training Steps: ~8.0 Surprisal
* 4000 Training Steps: ~7.2 Surprisal
* 6000 Training Steps: ~6.8 Surprisal
* 8000 Training Steps: ~6.6 Surprisal
* 10000 Training Steps: ~6.5 Surprisal
* 12000 Training Steps: ~6.5 Surprisal
* 14000 Training Steps: ~6.6 Surprisal
* 16000 Training Steps: ~6.7 Surprisal
* 18000 Training Steps: ~6.7 Surprisal
* 20000 Training Steps: ~6.8 Surprisal
### Key Observations
* The "Mismatch" condition consistently exhibits higher surprisal values than the "Match" condition throughout the training process.
* Both conditions demonstrate a decreasing trend in surprisal, suggesting that the model is learning and becoming more confident in its predictions.
* The "Mismatch" line shows more fluctuation, indicating that the model struggles more with mismatched data.
* The "Match" line appears to converge to a lower surprisal value, suggesting better performance on matched data.
### Interpretation
The chart likely represents the training dynamics of a model designed to identify matches or mismatches between data points. "Surprisal" can be interpreted as a measure of how unexpected or uncertain the model is about its predictions. A higher surprisal value indicates greater uncertainty.
The decreasing trend in both lines suggests that the model is learning to better distinguish between "Match" and "Mismatch" conditions as training progresses. The consistently higher surprisal for "Mismatch" indicates that the model finds it more difficult to process or predict mismatched data, which is expected. The convergence of the "Match" line to a lower surprisal value suggests that the model is becoming highly confident in its ability to identify matched data.
The fluctuations in the "Mismatch" line could indicate that the model is encountering diverse or challenging mismatched examples during training. This could be due to noise in the data, complex relationships between features, or limitations in the model's capacity. Further investigation into the nature of the mismatched data could provide insights into how to improve the model's performance.