\n
## Line Chart: Success Rate vs. Problem Size for Different Difficulties
### Overview
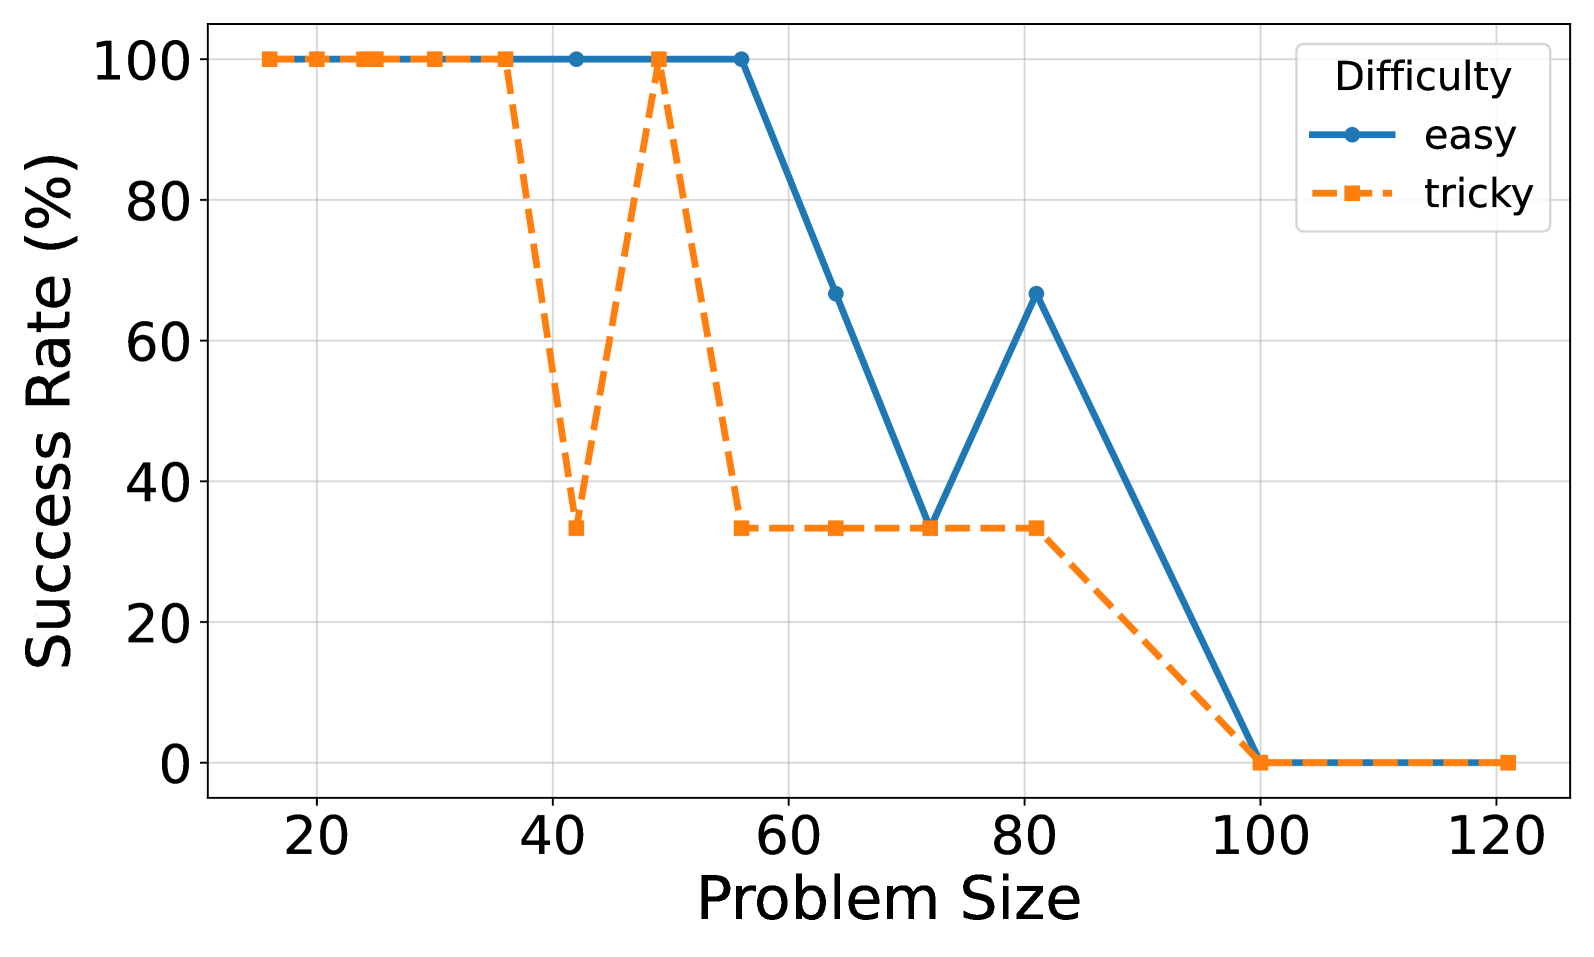
This line chart depicts the relationship between problem size and success rate for two difficulty levels: "easy" and "tricky". The chart shows how the success rate changes as the problem size increases.
### Components/Axes
* **X-axis:** "Problem Size" - ranging from approximately 20 to 120.
* **Y-axis:** "Success Rate (%)" - ranging from 0 to 100.
* **Legend:** Located in the top-right corner, labeling the two lines:
* "easy" - represented by a solid blue line.
* "tricky" - represented by a dashed orange line.
* **Gridlines:** Present to aid in reading values.
### Detailed Analysis
**Easy Difficulty (Blue Solid Line):**
The blue line representing "easy" difficulty starts at approximately 98% success rate at a problem size of 20. It remains relatively stable until around a problem size of 60, maintaining a success rate near 100%. From 60 to 80, the line slopes downward, decreasing to approximately 65% success rate at a problem size of 80. It then sharply declines from 80 to 100, reaching approximately 2% success rate at a problem size of 100. The line remains near 0% for problem sizes between 100 and 120.
* (20, 98)
* (40, 98)
* (60, 100)
* (80, 65)
* (100, 2)
* (120, 0)
**Tricky Difficulty (Orange Dashed Line):**
The orange dashed line representing "tricky" difficulty starts at approximately 98% success rate at a problem size of 20. It remains stable until around a problem size of 40, where it begins to decline. The line dips to approximately 33% success rate at a problem size of 40. It then rises slightly to around 35% at a problem size of 60, before declining again. From 60 to 80, the line remains relatively stable around 33%. From 80 to 100, the line slopes downward, decreasing to approximately 0% success rate at a problem size of 100. The line remains near 0% for problem sizes between 100 and 120.
* (20, 98)
* (40, 33)
* (60, 35)
* (80, 33)
* (100, 0)
* (120, 0)
### Key Observations
* The "easy" difficulty consistently outperforms the "tricky" difficulty across all problem sizes.
* Both difficulties experience a significant drop in success rate as the problem size increases beyond 60.
* The "easy" difficulty shows a more dramatic decline in success rate for problem sizes between 80 and 100.
* For problem sizes greater than 100, both difficulties have a success rate near 0%.
### Interpretation
The data suggests that the problem's difficulty significantly impacts the success rate, especially as the problem size increases. The "easy" problems remain solvable for larger problem sizes than the "tricky" problems, but both become intractable beyond a certain point (around a problem size of 100). The sharp decline in success rate for both difficulties beyond a certain problem size indicates a potential computational limit or algorithmic inefficiency. The initial high success rates for both difficulties suggest that the algorithms or methods used are effective for smaller problem sizes. The difference in performance between the two difficulties highlights the importance of problem formulation or the complexity of the underlying problem structure. The data could be used to inform the selection of appropriate algorithms or to identify areas for optimization to improve performance on larger, more complex problems.