## Line Graph: Success Rate vs. Problem Size
### Overview
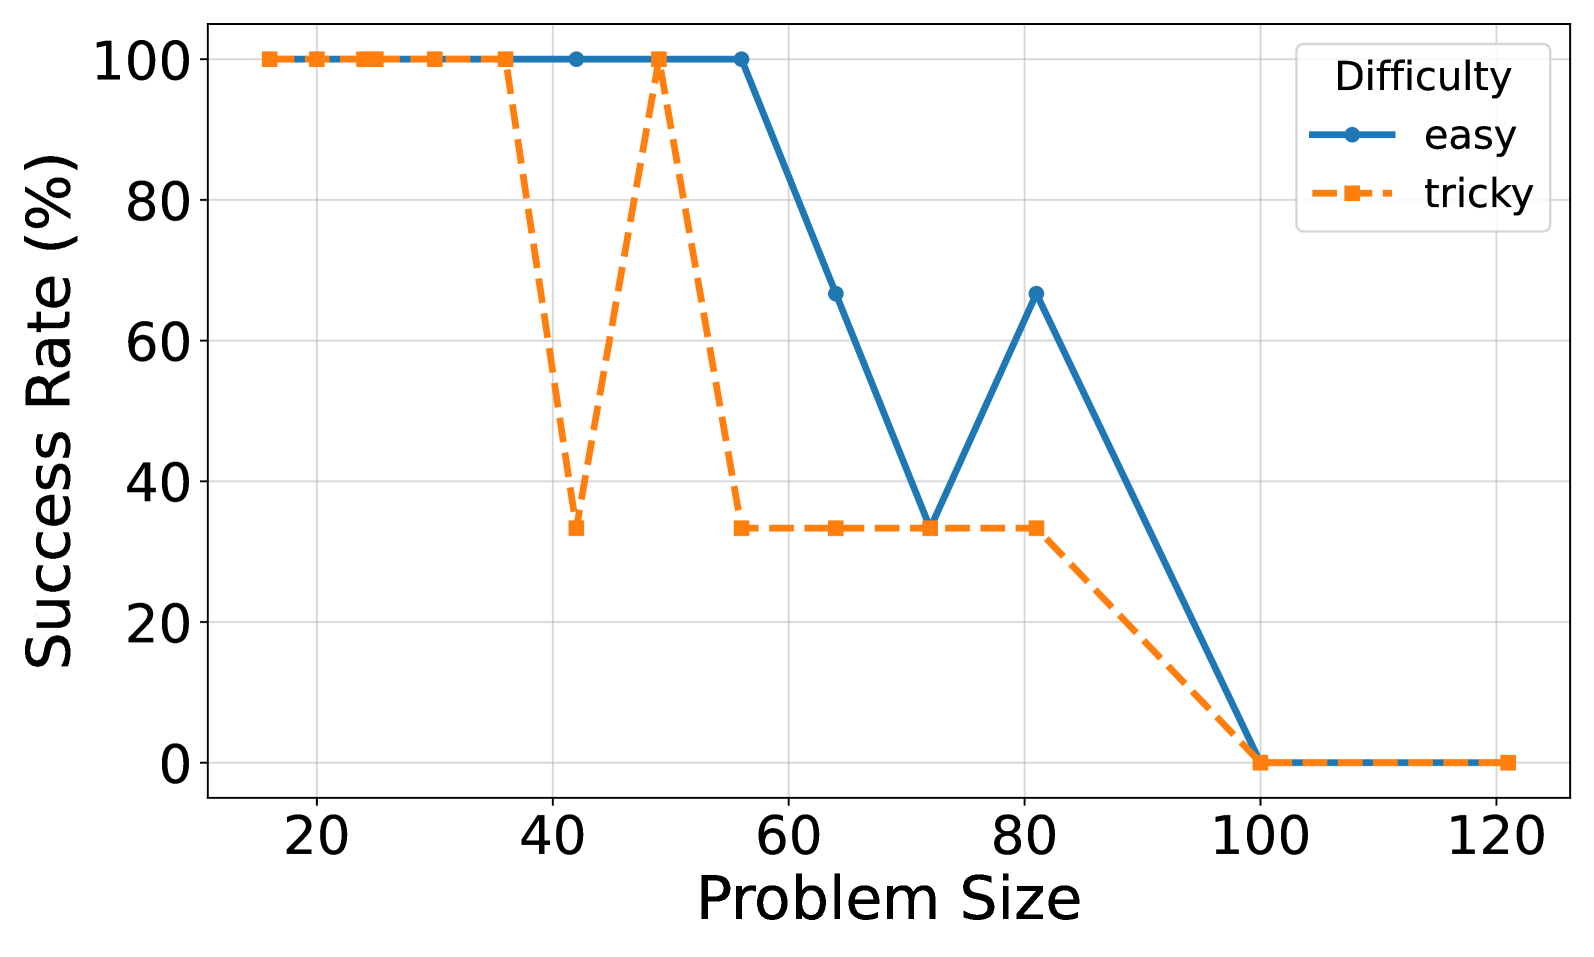
The graph compares success rates for "easy" and "tricky" problem categories across varying problem sizes (20–120). Two lines represent success rates: a solid blue line for "easy" and a dashed orange line for "tricky". Both lines start at 100% success rate but diverge significantly after problem size 40.
### Components/Axes
- **X-axis (Problem Size)**: Labeled from 20 to 120 in increments of 20.
- **Y-axis (Success Rate %)**: Labeled from 0 to 100 in increments of 20.
- **Legend**: Located in the top-right corner, with:
- Solid blue line: "easy"
- Dashed orange line: "tricky"
### Detailed Analysis
1. **Blue Line ("easy")**:
- **Trend**: Maintains 100% success rate from problem size 20 to 40.
- **Drop**: Sharp decline from 100% at 40 to 0% at 100, forming a straight diagonal line.
- **Post-100**: Remains at 0% until 120.
2. **Orange Line ("tricky")**:
- **Initial Stability**: Stays at 100% from 20 to 40.
- **Dip**: Falls to ~35% at 40, then rises sharply to 100% at 50.
- **Plateau**: Remains at 100% from 50 to 120.
### Key Observations
- **Threshold Behavior**: Both categories maintain perfect success rates until problem size 40.
- **Divergence at 40**: "Easy" problems collapse to 0% success rate by 100, while "tricky" problems recover to 100% by 50.
- **Asymmetry**: "Tricky" problems outperform "easy" problems at larger sizes (50–120), despite initial parity.
### Interpretation
The data suggests that "easy" problems are only solvable up to a critical problem size (~40), after which success rates plummet. In contrast, "tricky" problems exhibit resilience: their success rate recovers fully by problem size 50 and remains stable. This implies that "tricky" problems may involve adaptive strategies or resource allocation that scale effectively with complexity, whereas "easy" problems lack such flexibility. The abrupt drop in the "easy" line could indicate a phase transition or computational limitation at larger scales.