## Line Graphs and Bar Chart: Model Performance on CIFAR-100
### Overview
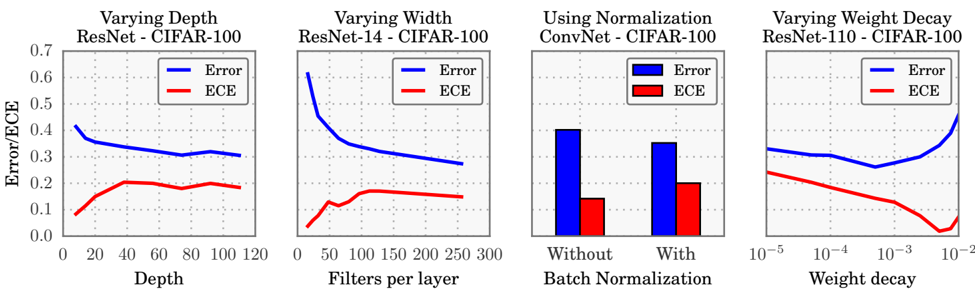
The image contains four visualizations comparing model performance metrics (Error and Expected Calibration Error, ECE) on the CIFAR-100 dataset. Each graph explores the impact of architectural or training parameter variations: depth, width, batch normalization, and weight decay. Data is presented as line graphs (for continuous parameters) and a bar chart (for binary comparison).
---
### Components/Axes
1. **Graph 1: Varying Depth (ResNet-CIFAR-100)**
- **X-axis**: Depth (0–120 layers)
- **Y-axis**: Error/ECE (0.0–0.7)
- **Legend**: Blue = Error, Red = ECE
- **Legend Position**: Top-right corner
2. **Graph 2: Varying Width (ResNet-14-CIFAR-100)**
- **X-axis**: Filters per layer (0–300)
- **Y-axis**: Error/ECE (0.0–0.7)
- **Legend**: Blue = Error, Red = ECE
- **Legend Position**: Top-right corner
3. **Graph 3: Batch Normalization (ConvNet-CIFAR-100)**
- **X-axis**: Binary categories ("Without", "With")
- **Y-axis**: Error/ECE (0.0–0.7)
- **Legend**: Blue = Error, Red = ECE
- **Legend Position**: Top-right corner
4. **Graph 4: Varying Weight Decay (ResNet-110-CIFAR-100)**
- **X-axis**: Weight decay (10⁻⁵ to 10⁻²)
- **Y-axis**: Error/ECE (0.0–0.7)
- **Legend**: Blue = Error, Red = ECE
- **Legend Position**: Top-right corner
---
### Detailed Analysis
#### Graph 1: Varying Depth
- **Error (Blue Line)**: Starts at ~0.4, decreases to ~0.3 by depth 60, then stabilizes.
- **ECE (Red Line)**: Peaks at ~0.2 at depth 40, then declines to ~0.1 by depth 120.
- **Key Data Points**:
- Depth 0: Error = 0.4, ECE = 0.1
- Depth 60: Error = 0.3, ECE = 0.15
- Depth 120: Error = 0.3, ECE = 0.1
#### Graph 2: Varying Width
- **Error (Blue Line)**: Starts at ~0.6, drops sharply to ~0.3 by 150 filters, then plateaus.
- **ECE (Red Line)**: Peaks at ~0.2 at 50 filters, then declines to ~0.1 by 300 filters.
- **Key Data Points**:
- 0 filters: Error = 0.6, ECE = 0.1
- 150 filters: Error = 0.3, ECE = 0.15
- 300 filters: Error = 0.3, ECE = 0.1
#### Graph 3: Batch Normalization
- **Without BN**:
- Error = 0.4
- ECE = 0.2
- **With BN**:
- Error = 0.3
- ECE = 0.1
- **Observation**: Batch normalization reduces both error and ECE by ~25%.
#### Graph 4: Varying Weight Decay
- **Error (Blue Line)**: U-shaped curve. Starts at ~0.3 (10⁻⁵), dips to ~0.2 (10⁻³), then rises to ~0.4 (10⁻²).
- **ECE (Red Line)**: V-shaped curve. Starts at ~0.2 (10⁻⁵), drops to ~0.1 (10⁻³), then rises to ~0.2 (10⁻²).
- **Key Data Points**:
- 10⁻⁵: Error = 0.3, ECE = 0.2
- 10⁻³: Error = 0.2, ECE = 0.1
- 10⁻²: Error = 0.4, ECE = 0.2
---
### Key Observations
1. **Depth vs. Width**: Increasing depth (Graph 1) and width (Graph 2) both reduce error, but ECE initially increases before stabilizing.
2. **Batch Normalization**: Significantly improves calibration (ECE drops from 0.2 to 0.1) and reduces error.
3. **Weight Decay**: Optimal performance occurs at moderate decay (10⁻³), with both error and ECE minimized.
---
### Interpretation
- **Depth/Width Trade-offs**: Deeper/wider networks improve accuracy but may overfit (higher ECE initially). However, ECE stabilizes as models become sufficiently complex.
- **Batch Normalization**: Critical for reducing both error and calibration error, suggesting it mitigates overconfidence in predictions.
- **Weight Decay**: Moderate regularization (10⁻³) balances model complexity and generalization. Extreme values (10⁻⁵ or 10⁻²) degrade performance, likely due to underfitting or overfitting.
- **Model Architecture**: ResNet variants (14, 110 layers) and ConvNet show similar trends, but ResNets handle deeper architectures better (Graph 1 vs. Graph 4).
This analysis highlights the interplay between architectural choices and training hyperparameters in achieving robust performance on CIFAR-100.