## Charts: Training Performance Comparison
### Overview
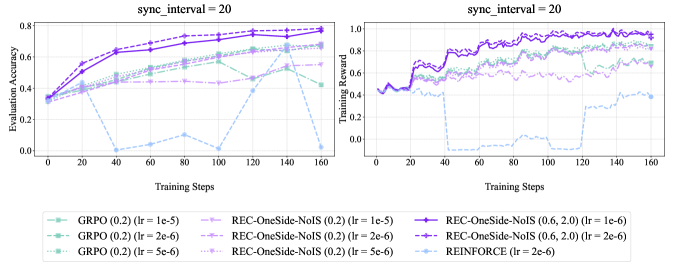
The image presents two line charts comparing the training performance of different reinforcement learning algorithms. Both charts share the same x-axis (Training Steps) but differ in their y-axis metrics: the left chart displays "Evaluation Accuracy", while the right chart shows "Training Reward". Both charts are labeled with `sync_interval = 20`. The charts visualize the performance of GRPO, REC-OneSide-NoIS, and REINFORCE algorithms under varying learning rates.
### Components/Axes
* **X-axis (Both Charts):** "Training Steps", ranging from 0 to 160, with markers at intervals of 20.
* **Left Chart Y-axis:** "Evaluation Accuracy", ranging from 0.0 to 0.8, with markers at intervals of 0.2.
* **Right Chart Y-axis:** "Training Reward", ranging from 0.0 to 1.0, with markers at intervals of 0.2.
* **Legend (Bottom Center):** Contains labels for each data series, including the algorithm name and learning rate (lr).
### Detailed Analysis or Content Details
**Left Chart (Evaluation Accuracy):**
* **GRPO (0.2) (lr = 1e-5):** Line starts at approximately 0.3, increases steadily to around 0.7 by step 80, then plateaus around 0.72-0.75. (Color: Light Green, Dashed)
* **GRPO (0.2) (lr = 2e-6):** Line starts at approximately 0.3, increases to around 0.6 by step 80, then plateaus around 0.65-0.7. (Color: Dark Green, Dashed-Dot)
* **GRPO (0.2) (lr = 5e-6):** Line starts at approximately 0.3, increases to around 0.5 by step 80, then plateaus around 0.55-0.6. (Color: Green, Dot)
* **REC-OneSide-NoIS (0.2) (lr = 1e-5):** Line starts at approximately 0.3, increases to around 0.65 by step 80, then plateaus around 0.65-0.7. (Color: Light Blue, Dashed)
* **REC-OneSide-NoIS (0.2) (lr = 2e-6):** Line starts at approximately 0.3, increases to around 0.55 by step 80, then plateaus around 0.55-0.6. (Color: Blue, Dashed-Dot)
* **REC-OneSide-NoIS (0.2) (lr = 5e-6):** Line starts at approximately 0.3, increases to around 0.45 by step 80, then plateaus around 0.45-0.5. (Color: Blue, Dot)
**Right Chart (Training Reward):**
* **REC-OneSide-NoIS (0.6, 2.0) (lr = 1e-6):** Line starts at approximately 0.4, fluctuates between 0.6 and 0.9, and stabilizes around 0.85-0.9. (Color: Dark Magenta, Solid)
* **REC-OneSide-NoIS (0.6, 2.0) (lr = 2e-6):** Line starts at approximately 0.4, fluctuates between 0.5 and 0.8, and stabilizes around 0.7-0.8. (Color: Magenta, Dashed)
* **REINFORCE (lr = 2e-6):** Line starts at approximately 0.4, fluctuates significantly between 0.2 and 0.8, and stabilizes around 0.6-0.7. (Color: Light Grey, Dot)
### Key Observations
* In the Evaluation Accuracy chart, GRPO (0.2) with a learning rate of 1e-5 consistently achieves the highest accuracy.
* Lower learning rates for GRPO and REC-OneSide-NoIS generally result in lower peak accuracy but potentially more stable training.
* The Training Reward chart shows that REC-OneSide-NoIS (0.6, 2.0) with a learning rate of 1e-6 achieves the highest and most stable reward.
* REINFORCE exhibits the most volatile training reward, suggesting potential instability.
### Interpretation
The data suggests that GRPO with a learning rate of 1e-5 performs best in terms of evaluation accuracy, while REC-OneSide-NoIS (0.6, 2.0) with a learning rate of 1e-6 achieves the highest and most stable training reward. The difference between the two charts indicates a potential trade-off between accuracy and reward. The instability observed in REINFORCE suggests that it may require more careful tuning or a different approach to stabilize training. The `sync_interval = 20` parameter likely refers to the frequency of synchronization between the actor and critic networks, and its value of 20 appears to be consistent across all experiments. The varying learning rates demonstrate the sensitivity of these algorithms to hyperparameter tuning. The REC-OneSide-NoIS algorithm appears to be more robust to learning rate changes than GRPO.