# Technical Document Extraction: AI Safety Performance Comparison
## 1. Image Overview
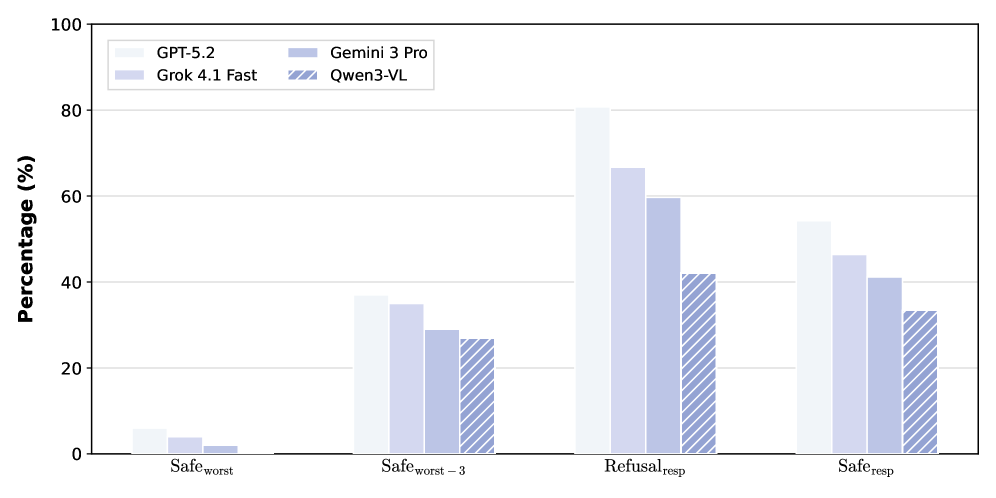
This image is a grouped bar chart comparing the performance of four Large Language Models (LLMs) across four distinct safety-related metrics. The data is presented as percentages.
## 2. Component Isolation
### A. Header / Legend
* **Location:** Top-left quadrant of the chart area.
* **Legend Items (Color-Coded):**
* **GPT-5.2:** Very light lavender/white solid fill.
* **Grok 4.1 Fast:** Light lavender solid fill.
* **Gemini 3 Pro:** Medium lavender solid fill.
* **Qwen3-VL:** Medium lavender with white diagonal hatching (slanted down-right).
### B. Main Chart Area (Axes)
* **Y-Axis Label:** Percentage (%)
* **Y-Axis Scale:** 0 to 100, with major gridlines and labels every 20 units (0, 20, 40, 60, 80, 100).
* **X-Axis Categories:** Four safety metrics:
1. $\text{Safe}_{\text{worst}}$
2. $\text{Safe}_{\text{worst}-3}$
3. $\text{Refusal}_{\text{resp}}$
4. $\text{Safe}_{\text{resp}}$
### C. Data Visualization
The chart uses four groups of bars. Within each group, the models are ordered from left to right: GPT-5.2, Grok 4.1 Fast, Gemini 3 Pro, and Qwen3-VL.
---
## 3. Data Extraction and Trend Analysis
### Trend Verification
Across all four categories, a consistent downward trend is observed from left to right within each group. **GPT-5.2** consistently shows the highest percentage values, followed by **Grok 4.1 Fast**, then **Gemini 3 Pro**, with **Qwen3-VL** consistently showing the lowest percentage values.
### Reconstructed Data Table (Estimated Values)
Values are extracted based on alignment with the Y-axis gridlines.
| Metric | GPT-5.2 (Solid White) | Grok 4.1 Fast (Light Lavender) | Gemini 3 Pro (Med Lavender) | Qwen3-VL (Hatched) |
| :--- | :---: | :---: | :---: | :---: |
| $\text{Safe}_{\text{worst}}$ | ~6% | ~4% | ~2% | ~0% |
| $\text{Safe}_{\text{worst}-3}$ | ~37% | ~35% | ~29% | ~27% |
| $\text{Refusal}_{\text{resp}}$ | ~81% | ~67% | ~60% | ~42% |
| $\text{Safe}_{\text{resp}}$ | ~54% | ~46% | ~41% | ~33% |
---
## 4. Detailed Component Analysis
* **$\text{Safe}_{\text{worst}}$:** This category shows the lowest overall performance for all models. GPT-5.2 is the only model significantly above the baseline, while Qwen3-VL appears to be at or near 0%.
* **$\text{Safe}_{\text{worst}-3}$:** Performance improves significantly here. The gap between GPT-5.2 and Grok 4.1 Fast is narrow (approx. 2%), while a larger gap exists between Grok and Gemini 3 Pro.
* **$\text{Refusal}_{\text{resp}}$:** This category contains the highest values in the dataset. GPT-5.2 peaks above 80%. This is also the category with the most significant variance between the top performer (GPT-5.2) and the bottom performer (Qwen3-VL), with a difference of nearly 40 percentage points.
* **$\text{Safe}_{\text{resp}}$:** Shows a moderate performance level. The "step-down" pattern between models is very regular in this category, with each model trailing the previous one by roughly 5-8%.
## 5. Language Declaration
The text in this image is entirely in **English**, utilizing standard mathematical/technical subscripts for category labels (e.g., "worst", "resp").