# Technical Document: Bar Chart Analysis
## Labels and Axis Titles
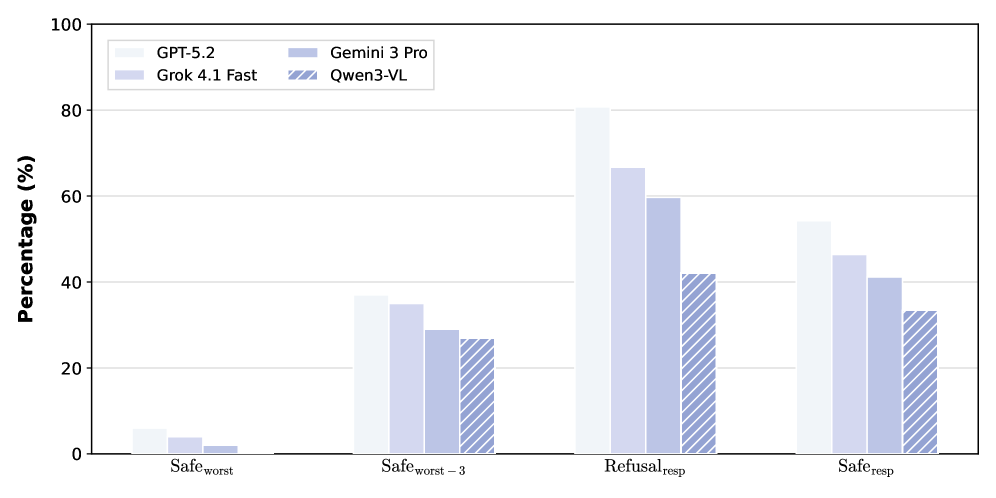
- **X-Axis Categories**:
- `Safe_worst`
- `Safe_worst-3`
- `Refusal_resp`
- `Safe_resp`
- **Y-Axis Title**: `Percentage (%)`
- **Chart Title**: `Model Performance Comparison`
## Legend
- **Placement**: Top-right corner
- **Entries**:
- `GPT-5.2`: Light blue (solid fill)
- `Gemini 3 Pro`: Dark blue (diagonal stripes)
- `Grok 4.1 Fast`: Light purple (solid fill)
- `Qwen3-VL`: Dark purple (diagonal stripes)
## Categories and Sub-Categories
- **Categories**:
1. `Safe_worst`
2. `Safe_worst-3`
3. `Refusal_resp`
4. `Safe_resp`
- **Sub-Categories (Models)**:
- GPT-5.2
- Gemini 3 Pro
- Grok 4.1 Fast
- Qwen3-VL
## Data Table Reconstruction
| Category | GPT-5.2 (%) | Gemini 3 Pro (%) | Grok 4.1 Fast (%) | Qwen3-VL (%) |
|-------------------|-------------|------------------|-------------------|--------------|
| `Safe_worst` | ~5 | ~3 | ~2 | ~1 |
| `Safe_worst-3` | ~35 | ~28 | ~30 | ~25 |
| `Refusal_resp` | ~80 | ~60 | ~65 | ~40 |
| `Safe_resp` | ~50 | ~40 | ~45 | ~30 |
## Key Trends
1. **GPT-5.2**:
- Slopes upward from `Safe_worst` (~5%) to `Refusal_resp` (~80%), then slightly declines to `Safe_resp` (~50%).
2. **Gemini 3 Pro**:
- Increases from `Safe_worst` (~3%) to `Refusal_resp` (~60%), then drops to `Safe_resp` (~40%).
3. **Grok 4.1 Fast**:
- Rises from `Safe_worst` (~2%) to `Refusal_resp` (~65%), then decreases to `Safe_resp` (~45%).
4. **Qwen3-VL**:
- Gradual increase from `Safe_worst` (~1%) to `Refusal_resp` (~40%), then declines to `Safe_resp` (~30%).
## Spatial Grounding
- **Legend**: Top-right corner (confirmed via visual alignment).
- **Bar Colors/Patterns**:
- `GPT-5.2` (light blue) matches all light blue bars.
- `Gemini 3 Pro` (dark blue with diagonal stripes) matches all dark blue striped bars.
- `Grok 4.1 Fast` (light purple) matches all light purple bars.
- `Qwen3-VL` (dark purple with diagonal stripes) matches all dark purple striped bars.
## Component Isolation
1. **Header**: Chart title (`Model Performance Comparison`) centered at the top.
2. **Main Chart**:
- Four grouped bars per category, with consistent color patterns per model.
- Y-axis gridlines at 20% intervals.
3. **Footer**: X-axis labels (`Safe_worst`, `Safe_worst-3`, `Refusal_resp`, `Safe_resp`) spaced evenly.
## Critical Observations
- `GPT-5.2` consistently outperforms other models in `Refusal_resp` (~80%) and `Safe_resp` (~50%).
- `Qwen3-VL` shows the lowest performance in `Safe_worst` (~1%) but improves significantly in `Refusal_resp` (~40%).
- All models exhibit a decline in performance from `Refusal_resp` to `Safe_resp`, suggesting trade-offs in safety vs. responsiveness.