## Scatter Plot: logical_fallacies
### Overview
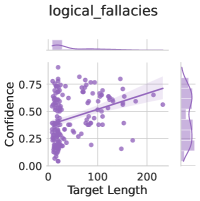
The image is a scatter plot titled "logical_fallacies". It displays the relationship between "Target Length" on the x-axis and "Confidence" on the y-axis. The plot includes a regression line with a shaded confidence interval. Marginal distributions are shown as histograms along the top and right edges of the scatter plot. All data points and lines are colored in a light purple hue.
### Components/Axes
* **Title:** logical\_fallacies
* **X-axis:**
* Label: Target Length
* Scale: 0 to approximately 225
* **Y-axis:**
* Label: Confidence
* Scale: 0.00 to 0.75
* **Data Points:** Light purple dots representing individual data points.
* **Regression Line:** A light purple line showing the linear regression fit to the data.
* **Confidence Interval:** A shaded light purple region around the regression line, indicating the uncertainty in the regression estimate.
* **Marginal Distributions:**
* Top: Histogram of Target Length
* Right: Histogram of Confidence
### Detailed Analysis
* **Target Length:** Ranges from approximately 0 to 225.
* **Confidence:** Ranges from 0.00 to 0.75.
* **Trend:** The regression line shows a positive correlation between Target Length and Confidence. As Target Length increases, Confidence tends to increase as well.
* **Data Point Distribution:** The data points are more densely clustered at lower Target Length values.
* **Marginal Distributions:**
* Target Length: Skewed to the right, indicating that most data points have lower Target Length values.
* Confidence: Appears to be somewhat bimodal, with peaks around 0.25 and 0.75.
### Key Observations
* There is a positive correlation between Target Length and Confidence.
* The data is more concentrated at lower Target Length values.
* The Confidence values appear to be somewhat clustered around two levels.
### Interpretation
The scatter plot suggests that there is a tendency for higher confidence scores to be associated with longer target lengths. However, the spread of the data points indicates that this relationship is not deterministic. The higher density of data points at lower target lengths suggests that shorter targets are more common in the dataset. The bimodal distribution of confidence values could indicate the presence of two distinct groups or categories within the data. Further analysis would be needed to understand the underlying factors driving these patterns.