## Scatter Plot with Marginal Distributions: logical_fallacies
### Overview
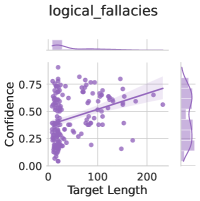
The image is a statistical visualization, specifically a scatter plot with marginal distribution plots (histograms and density curves) on the top and right sides. The chart explores the relationship between two variables: "Target Length" and "Confidence." A linear regression line with a shaded confidence interval is overlaid on the scatter plot.
### Components/Axes
* **Main Chart Area:**
* **X-Axis:** Labeled "Target Length". The scale runs from 0 to 200, with major tick marks at 0, 100, and 200.
* **Y-Axis:** Labeled "Confidence". The scale runs from 0.00 to 0.75, with major tick marks at 0.00, 0.25, 0.50, and 0.75.
* **Data Series:** Individual data points are represented as purple circles.
* **Trend Line:** A solid purple line representing a linear regression fit.
* **Confidence Band:** A semi-transparent purple shaded area surrounding the trend line, indicating the confidence interval for the regression.
* **Marginal Plots:**
* **Top Marginal Plot (above X-axis):** A histogram and density curve showing the distribution of the "Target Length" variable.
* **Right Marginal Plot (right of Y-axis):** A histogram and density curve showing the distribution of the "Confidence" variable.
* **Legend:** Located in the top-left corner of the main chart area. It contains a single entry: a purple circle labeled "Data".
* **Title:** The text "logical_fallacies" is centered at the very top of the image.
### Detailed Analysis
* **Data Point Distribution:** The scatter plot contains approximately 80-100 data points. The points are most densely clustered in the region where "Target Length" is between 0 and 100 and "Confidence" is between 0.25 and 0.60.
* **Trend Line Analysis:** The purple regression line shows a clear, gentle upward slope from left to right. It originates at approximately (Target Length: 0, Confidence: ~0.35) and terminates at approximately (Target Length: 200, Confidence: ~0.55). This indicates a positive correlation between the two variables.
* **Confidence Interval:** The shaded confidence band is narrowest in the center of the data range (around Target Length 50-150) and widens noticeably at the extremes, particularly for Target Length values greater than 150, indicating greater uncertainty in the trend estimate where data is sparse.
* **Marginal Distributions:**
* **Target Length (Top):** The distribution is right-skewed. The highest frequency (tallest bar) is in the first bin (0-20). The density curve peaks sharply near 0 and tails off gradually towards 200.
* **Confidence (Right):** The distribution appears roughly unimodal and slightly left-skewed. The peak of the density curve is near a Confidence value of 0.45. The data spans from near 0.00 to just above 0.75.
### Key Observations
1. **Positive Correlation:** There is a visible, albeit modest, positive linear relationship. As "Target Length" increases, "Confidence" tends to increase as well.
2. **Data Sparsity at High Values:** There are very few data points with a "Target Length" greater than 150, which contributes to the widening confidence interval in that region.
3. **Outliers:** Several data points exist with high "Confidence" (>0.65) across various "Target Length" values. A few points also have very low "Confidence" (<0.10).
4. **Variable Distributions:** The two variables have distinctly different distributions. "Target Length" is heavily concentrated near zero, while "Confidence" is more centrally distributed.
### Interpretation
The chart suggests that within the dataset labeled "logical_fallacies," there is a weak to moderate positive association between the length of a target (presumably a text or argument) and a confidence metric. This could imply that longer targets are associated with slightly higher confidence scores, or that the system/model being evaluated exhibits this bias.
However, the relationship is not strong, as evidenced by the wide scatter of points around the trend line. The significant number of points with high confidence at low target lengths indicates that short targets can also yield high confidence, which may be an important finding or potential anomaly depending on the context. The right-skew of "Target Length" is a critical characteristic of the dataset, meaning most samples are short, and conclusions about very long targets are based on limited data. The marginal plots are essential for understanding that the apparent trend is derived from a dataset where one variable ("Target Length") is not uniformly distributed.