## Chart: gSSNR gain vs TotERITF
### Overview
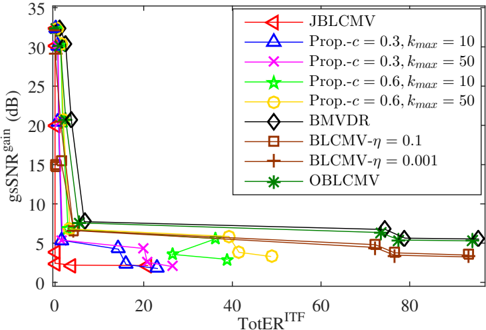
The image is a line chart comparing the performance of different algorithms (JBLCMV, Prop, BMVDR, BLCMV, OBLCMV) in terms of gSSNR gain (dB) versus TotERITF. The chart displays multiple data series, each representing a different algorithm or configuration. The x-axis represents TotERITF, and the y-axis represents gSSNR gain in dB.
### Components/Axes
* **X-axis:** TotERITF, ranging from 0 to approximately 90.
* **Y-axis:** gSSNR gain (dB), ranging from 0 to 35.
* **Title:** gSSNR gain (dB) vs TotERITF (inferred from axis labels and context).
* **Legend (Top-Right):**
* Red triangle: JBLCMV
* Blue triangle: Prop.-c = 0.3, kmax = 10
* Magenta x: Prop.-c = 0.3, kmax = 50
* Light green star: Prop.-c = 0.6, kmax = 10
* Yellow circle: Prop.-c = 0.6, kmax = 50
* Black diamond: BMVDR
* Brown square: BLCMV-η = 0.1
* Red plus: BLCMV-η = 0.001
* Dark green asterisk: OBLCMV
### Detailed Analysis
* **JBLCMV (Red Triangles):** Starts at approximately (0, 4) and increases slightly before decreasing and remaining relatively flat around 2-4 dB.
* **Prop.-c = 0.3, kmax = 10 (Blue Triangles):** Starts at approximately (0, 5) and increases to approximately (15, 6) before decreasing and remaining relatively flat around 4-6 dB.
* **Prop.-c = 0.3, kmax = 50 (Magenta x):** Starts at approximately (0, 6) and increases to approximately (15, 5) before decreasing and remaining relatively flat around 2-5 dB.
* **Prop.-c = 0.6, kmax = 10 (Light green star):** Starts at approximately (0, 7) and increases to approximately (40, 6) before decreasing and remaining relatively flat around 4-7 dB.
* **Prop.-c = 0.6, kmax = 50 (Yellow circle):** Starts at approximately (0, 7) and increases to approximately (40, 5) before decreasing and remaining relatively flat around 4-6 dB.
* **BMVDR (Black Diamonds):** Starts at approximately (0, 20) and decreases sharply to approximately (5, 8) before increasing and remaining relatively flat around 6-8 dB.
* **BLCMV-η = 0.1 (Brown Squares):** Starts at approximately (0, 15) and decreases sharply to approximately (5, 7) before increasing and remaining relatively flat around 6-7 dB.
* **BLCMV-η = 0.001 (Red Plus):** Starts at approximately (0, 30) and decreases sharply to approximately (5, 7) before increasing and remaining relatively flat around 6-7 dB.
* **OBLCMV (Dark green Asterisk):** Starts at approximately (0, 33) and decreases sharply to approximately (5, 8) before increasing and remaining relatively flat around 6-8 dB.
### Key Observations
* The algorithms OBLCMV, BLCMV-η = 0.001, and BMVDR show the highest initial gSSNR gain but experience a sharp decrease as TotERITF increases.
* The "Prop" algorithms generally have lower initial gSSNR gain but maintain a more stable performance as TotERITF increases.
* All algorithms tend to converge to a relatively flat gSSNR gain as TotERITF increases beyond 20.
### Interpretation
The chart illustrates a trade-off between initial gSSNR gain and stability with respect to TotERITF. Algorithms like OBLCMV and BMVDR offer high initial gain but are more sensitive to changes in TotERITF. In contrast, the "Prop" algorithms provide a more consistent performance across different TotERITF values, albeit at a lower initial gain. The choice of algorithm would depend on the specific application and the importance of initial gain versus stability. The BLCMV algorithms perform similarly to BMVDR and OBLCMV.