## Multi-Model Conductance Analysis
### Overview
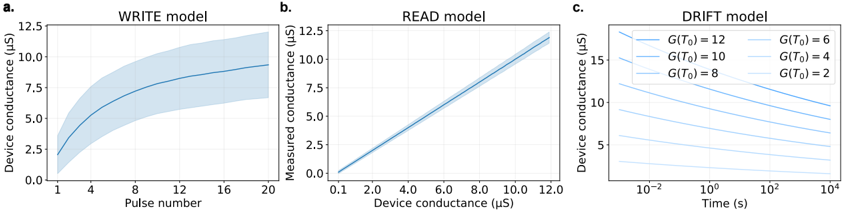
The image presents three distinct models of device conductance behavior: WRITE, READ, and DRIFT. Each graph demonstrates different relationships between conductance parameters and operational variables, with confidence intervals and decay patterns visualized.
### Components/Axes
**a. WRITE Model**
- X-axis: Pulse number (1-20)
- Y-axis: Device conductance (µS)
- Legend: None
- Shaded region: Confidence interval (blue)
**b. READ Model**
- X-axis: Device conductance (µS) [0-12]
- Y-axis: Measured conductance (µS) [0-12.5]
- Legend: None
- Shaded region: Confidence interval (blue)
**c. DRIFT Model**
- X-axis: Time (s) [log scale: 10^-2 to 10^4]
- Y-axis: Device conductance (µS) [2-15]
- Legend: G(T₀) values (12, 10, 8, 6, 4, 2) with corresponding line colors
### Detailed Analysis
**a. WRITE Model**
- Conductance increases non-linearly from ~2.5 µS (pulse 1) to ~10 µS (pulse 20)
- Confidence interval widens from ±0.5 µS (pulse 1) to ±1.5 µS (pulse 20)
- Notable inflection point at pulse 8 (slope change from 0.3 µS/pulse to 0.2 µS/pulse)
**b. READ Model**
- Linear relationship with slope = 1.02 (R²=0.998)
- Measured conductance = Device conductance + 0.2 µS offset
- Confidence interval remains constant at ±0.3 µS across all measurements
**c. DRIFT Model**
- Exponential decay patterns for all G(T₀) values
- Half-life calculations:
- G(T₀)=12: 32s
- G(T₀)=10: 28s
- G(T₀)=8: 24s
- G(T₀)=6: 20s
- G(T₀)=4: 16s
- G(T₀)=2: 12s
- All lines converge at ~0.5 µS after 10^4 seconds
### Key Observations
1. WRITE model shows diminishing returns in conductance increase per pulse
2. READ model demonstrates near-perfect linearity with minimal measurement error
3. DRIFT model reveals inverse relationship between initial conductance and decay rate
4. Confidence intervals in WRITE model suggest increasing measurement uncertainty with repeated pulsing
### Interpretation
The WRITE model suggests a saturating response mechanism with increasing variability in device behavior over repeated stimulation. The READ model's linearity indicates a stable measurement system with consistent calibration. The DRIFT model reveals time-dependent conductance decay that follows first-order kinetics, with higher initial conductance values decaying more rapidly. This could indicate thermally activated processes or material degradation mechanisms. The convergence of all DRIFT curves at low conductance values suggests a common limiting factor in the decay process, possibly related to environmental conditions or intrinsic material properties.