## Waveform Charts: Sound Event Analysis
### Overview
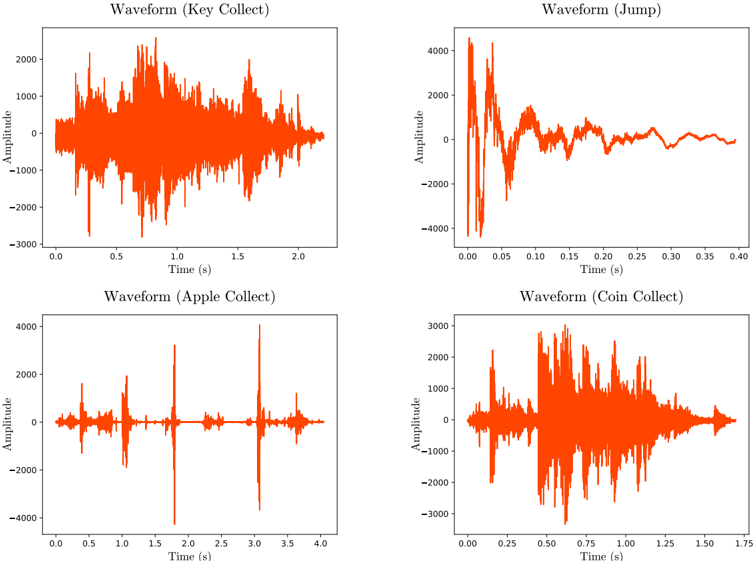
The image presents four waveform charts, each representing the amplitude of a sound event over time. The events are "Key Collect," "Jump," "Apple Collect," and "Coin Collect." Each chart displays the sound's amplitude on the y-axis and time in seconds on the x-axis. The waveforms are plotted in orange.
### Components/Axes
* **Titles:** Each chart has a title indicating the sound event it represents: "Waveform (Key Collect)," "Waveform (Jump)," "Waveform (Apple Collect)," and "Waveform (Coin Collect)."
* **X-axis:** Represents time in seconds (s).
* "Key Collect": Ranges from 0.0 to 2.0 s.
* "Jump": Ranges from 0.00 to 0.40 s.
* "Apple Collect": Ranges from 0.0 to 4.0 s.
* "Coin Collect": Ranges from 0.00 to 1.75 s.
* **Y-axis:** Represents amplitude.
* "Key Collect": Ranges from -3000 to 2000.
* "Jump": Ranges from -4000 to 4000.
* "Apple Collect": Ranges from -4000 to 4000.
* "Coin Collect": Ranges from -3000 to 3000.
* **Data Series:** Each chart contains a single data series plotted in orange, representing the amplitude of the sound event over time.
### Detailed Analysis
**1. Waveform (Key Collect)**
* **Trend:** The waveform shows a complex pattern with varying amplitudes over the 2-second duration. There is a significant increase in amplitude between 0.5 and 1.5 seconds, followed by a decrease.
* **Values:**
* Time = 0.0 s, Amplitude ≈ 0
* Time = 0.75 s, Amplitude ≈ 2000
* Time = 1.0 s, Amplitude ≈ 1500
* Time = 2.0 s, Amplitude ≈ 0
**2. Waveform (Jump)**
* **Trend:** The waveform shows a sharp initial spike in amplitude, followed by a rapid decay and oscillations that dampen over time.
* **Values:**
* Time = 0.00 s, Amplitude ≈ -4000
* Time = 0.02 s, Amplitude ≈ 4000
* Time = 0.10 s, Amplitude ≈ 1000
* Time = 0.40 s, Amplitude ≈ 0
**3. Waveform (Apple Collect)**
* **Trend:** The waveform shows several distinct spikes in amplitude, indicating short bursts of sound.
* **Values:**
* Time = 0.0 s, Amplitude ≈ 0
* Time = 0.75 s, Amplitude ≈ -1500
* Time = 1.5 s, Amplitude ≈ 2500
* Time = 2.0 s, Amplitude ≈ -1000
* Time = 3.0 s, Amplitude ≈ 4000
* Time = 4.0 s, Amplitude ≈ 0
**4. Waveform (Coin Collect)**
* **Trend:** The waveform shows a complex pattern with varying amplitudes, similar to the "Key Collect" waveform, but compressed into a shorter time frame.
* **Values:**
* Time = 0.00 s, Amplitude ≈ 0
* Time = 0.50 s, Amplitude ≈ 2500
* Time = 0.75 s, Amplitude ≈ -2000
* Time = 1.00 s, Amplitude ≈ 2000
* Time = 1.75 s, Amplitude ≈ 0
### Key Observations
* The "Jump" waveform has the shortest duration and a distinct impulse-like shape.
* The "Apple Collect" waveform shows discrete, well-separated sound events.
* The "Key Collect" and "Coin Collect" waveforms have more complex and continuous amplitude variations.
### Interpretation
The waveforms provide a visual representation of the sound characteristics of different events. The "Jump" waveform likely represents a transient sound, while the "Apple Collect" waveform represents a series of distinct sounds, possibly individual impacts. The "Key Collect" and "Coin Collect" waveforms suggest more complex and sustained sounds, potentially involving multiple components or reverberations. These visualizations can be used for sound event classification, analysis, and synthesis.