## Waveform Charts: Action-Specific Amplitude-Time Analysis
### Overview
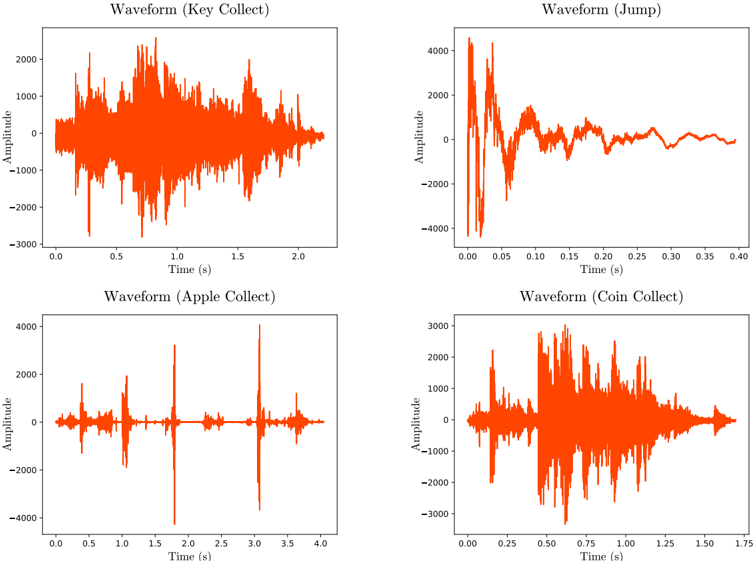
The image contains four distinct waveform charts, each labeled with a specific action ("Key Collect," "Jump," "Apple Collect," "Coin Collect"). All charts plot **Amplitude** (y-axis) against **Time (s)** (x-axis) using orange-colored data points. The charts exhibit varying amplitude ranges, durations, and temporal patterns, suggesting differences in the physical or sensor-based characteristics of each action.
---
### Components/Axes
1. **X-Axis (Time)**:
- Labeled "Time (s)" across all charts.
- Time ranges vary:
- Key Collect: 0.0–2.0s
- Jump: 0.0–0.4s
- Apple Collect: 0.0–4.0s
- Coin Collect: 0.0–1.75s
2. **Y-Axis (Amplitude)**:
- Labeled "Amplitude" across all charts.
- Amplitude ranges vary:
- Key Collect: -3000 to 2000
- Jump: -4000 to 4000
- Apple Collect: -6000 to 4000
- Coin Collect: -3000 to 3000
3. **Legend**:
- No explicit legend is visible, but all data points are uniformly orange. This implies a single data series per chart.
---
### Detailed Analysis
#### Waveform (Key Collect)
- **Trend**: Highly erratic with frequent sharp peaks and troughs. Amplitude fluctuates rapidly between -3000 and 2000.
- **Key Data Points**:
- Sharp spike at ~0.5s (amplitude ~1500).
- Sustained oscillations between 0.8s–1.5s.
- Gradual decay toward 2.0s.
#### Waveform (Jump)
- **Trend**: Sudden amplitude spike at 0.0s (peak ~4000), followed by rapid decay. Stabilizes near baseline (-1000 to 1000) after 0.1s.
- **Key Data Points**:
- Initial spike at 0.0s (amplitude ~4000).
- Sharp drop to -2000 at 0.05s.
- Minimal activity after 0.15s.
#### Waveform (Apple Collect)
- **Trend**: Two dominant spikes: one at ~0.5s (amplitude ~3000) and another at ~3.0s (amplitude ~2500). Baseline activity between spikes.
- **Key Data Points**:
- First spike at 0.5s (amplitude ~3000).
- Second spike at 3.0s (amplitude ~2500).
- Sustained oscillations between 2.5s–3.5s.
#### Waveform (Coin Collect)
- **Trend**: Gradual amplitude increase from 0.0s–1.0s, followed by a sharp peak at 1.5s (amplitude ~3000). Post-peak decay.
- **Key Data Points**:
- Baseline activity (amplitude ~0) until 1.0s.
- Sharp rise to 3000 at 1.5s.
- Rapid decay to -2000 by 1.75s.
---
### Key Observations
1. **Duration Variability**:
- "Jump" has the shortest duration (0.4s), while "Apple Collect" spans the longest (4.0s).
2. **Amplitude Extremes**:
- "Apple Collect" exhibits the highest negative amplitude (-6000), while "Jump" has the highest positive amplitude (~4000).
3. **Temporal Patterns**:
- "Key Collect" and "Coin Collect" show sustained oscillations, whereas "Jump" is a transient event.
- "Apple Collect" has bimodal spikes, suggesting two distinct phases of activity.
---
### Interpretation
1. **Action-Specific Dynamics**:
- **Jump**: Likely a brief, high-impact action (e.g., physical jump) with rapid energy dissipation.
- **Apple Collect**: Suggests a prolonged interaction (e.g., picking up an object) with two distinct engagement phases.
- **Coin Collect**: Indicates a gradual buildup of activity (e.g., reaching for a coin) followed by a sudden peak (e.g., grasping).
- **Key Collect**: Represents erratic, high-frequency motion (e.g., rapid key presses or vibrations).
2. **Sensor Sensitivity**:
- The amplitude ranges (-6000 to 4000) imply a sensor capable of detecting both high-intensity and low-intensity movements.
3. **Anomalies**:
- The abrupt decay in "Jump" after 0.1s may indicate a reset or stabilization mechanism.
- The bimodal spikes in "Apple Collect" could reflect a two-step process (e.g., grasping and lifting).
4. **Practical Implications**:
- These waveforms could be used to classify human actions via machine learning models, with distinct temporal and amplitude signatures for each activity.
- The "Key Collect" waveform’s noise might require filtering for applications like gesture recognition.