## Heatmap: Q*_1(v) and Q*_2(v²) Across Alpha Values (α = 1.75, 2.75, 3.75)
### Overview
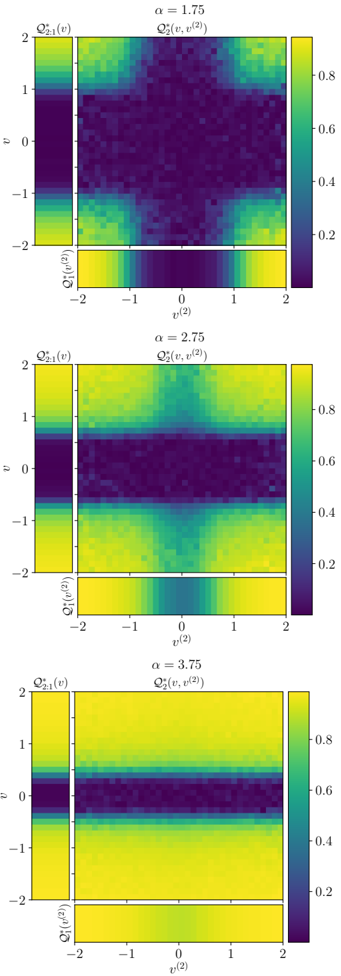
The image displays three vertically stacked heatmaps, each corresponding to a distinct α value (1.75, 2.75, 3.75). Each heatmap compares two functions:
- **Left**: Q*_1(v) plotted against v (y-axis: -2 to 2).
- **Right**: Q*_2(v²) plotted against v² (x-axis: -2 to 2).
Color intensity represents function values, with a shared scale (0.2–0.8) indicated by a colorbar on the right. Purple denotes low values, yellow high values.
---
### Components/Axes
1. **X-Axes**:
- Q*_1(v): v (y-axis: -2 to 2).
- Q*_2(v²): v² (x-axis: -2 to 2).
2. **Y-Axes**:
- Q*_1(v): v (x-axis: -2 to 2).
- Q*_2(v²): v² (x-axis: -2 to 2).
3. **Colorbar**:
- Scale: 0.2 (dark purple) to 0.8 (bright yellow).
- Position: Right of each heatmap.
4. **Labels**:
- Top of each subplot: α value (1.75, 2.75, 3.75).
- Subplot titles: Q*_1(v) (left) and Q*_2(v²) (right).
---
### Detailed Analysis
#### α = 1.75
- **Q*_1(v)**:
- Gradient transitions from purple (bottom) to yellow (top), indicating increasing values with v.
- Central region (v ≈ 0) shows moderate values (~0.4–0.6).
- **Q*_2(v²)**:
- Central dark purple band (v² ≈ 0) suggests low values (~0.2–0.3).
- Outer regions (v² ≈ ±2) transition to yellow (~0.6–0.8).
#### α = 2.75
- **Q*_1(v)**:
- Horizontal gradient: Purple (bottom) to yellow (top), with a sharp transition near v ≈ 0.
- Central band (v ≈ 0) remains dark purple (~0.2–0.3).
- **Q*_2(v²)**:
- Vertical dark band (v² ≈ 0) persists but narrows slightly.
- Outer regions (v² ≈ ±2) show higher values (~0.6–0.7).
#### α = 3.75
- **Q*_1(v)**:
- Dominantly yellow gradient, with a narrow purple band near v ≈ 0.
- Central region (~0.2–0.3) contrasts sharply with surrounding values (~0.7–0.8).
- **Q*_2(v²)**:
- Central dark band (v² ≈ 0) remains prominent but slightly wider.
- Outer regions (v² ≈ ±2) exhibit high values (~0.7–0.8).
---
### Key Observations
1. **Q*_1(v) Trends**:
- As α increases, the gradient becomes steeper, with a sharper transition from purple to yellow.
- Central regions (v ≈ 0) consistently show lower values, narrowing with higher α.
2. **Q*_2(v²) Trends**:
- Central dark bands (v² ≈ 0) persist across all α values, indicating a consistent low-value region.
- Outer regions (v² ≈ ±2) show increasing values with higher α.
3. **Color Consistency**:
- Purple always corresponds to ~0.2–0.3, yellow to ~0.6–0.8, matching the colorbar.
---
### Interpretation
- **α Dependency**:
- Higher α values amplify gradients in Q*_1(v) and sharpen the central low-value band in Q*_2(v²). This suggests α controls sensitivity to input magnitude.
- **Functional Relationship**:
- Q*_1(v) and Q*_2(v²) exhibit inverse patterns: Q*_1(v) increases with |v|, while Q*_2(v²) peaks at |v²| = 2.
- **Potential Applications**:
- The heatmaps may represent loss landscapes or decision boundaries in optimization problems, where α regulates exploration/exploitation trade-offs.
- **Anomalies**:
- At α = 3.75, Q*_1(v) shows an abrupt transition near v ≈ 0, possibly indicating a phase shift or threshold behavior.
This analysis highlights how α modulates the behavior of Q*_1 and Q*_2, with implications for tuning hyperparameters in systems governed by these functions.