## Heatmap: Baseline - Short-to-Long - Qwen-2.5 1.5B
### Overview
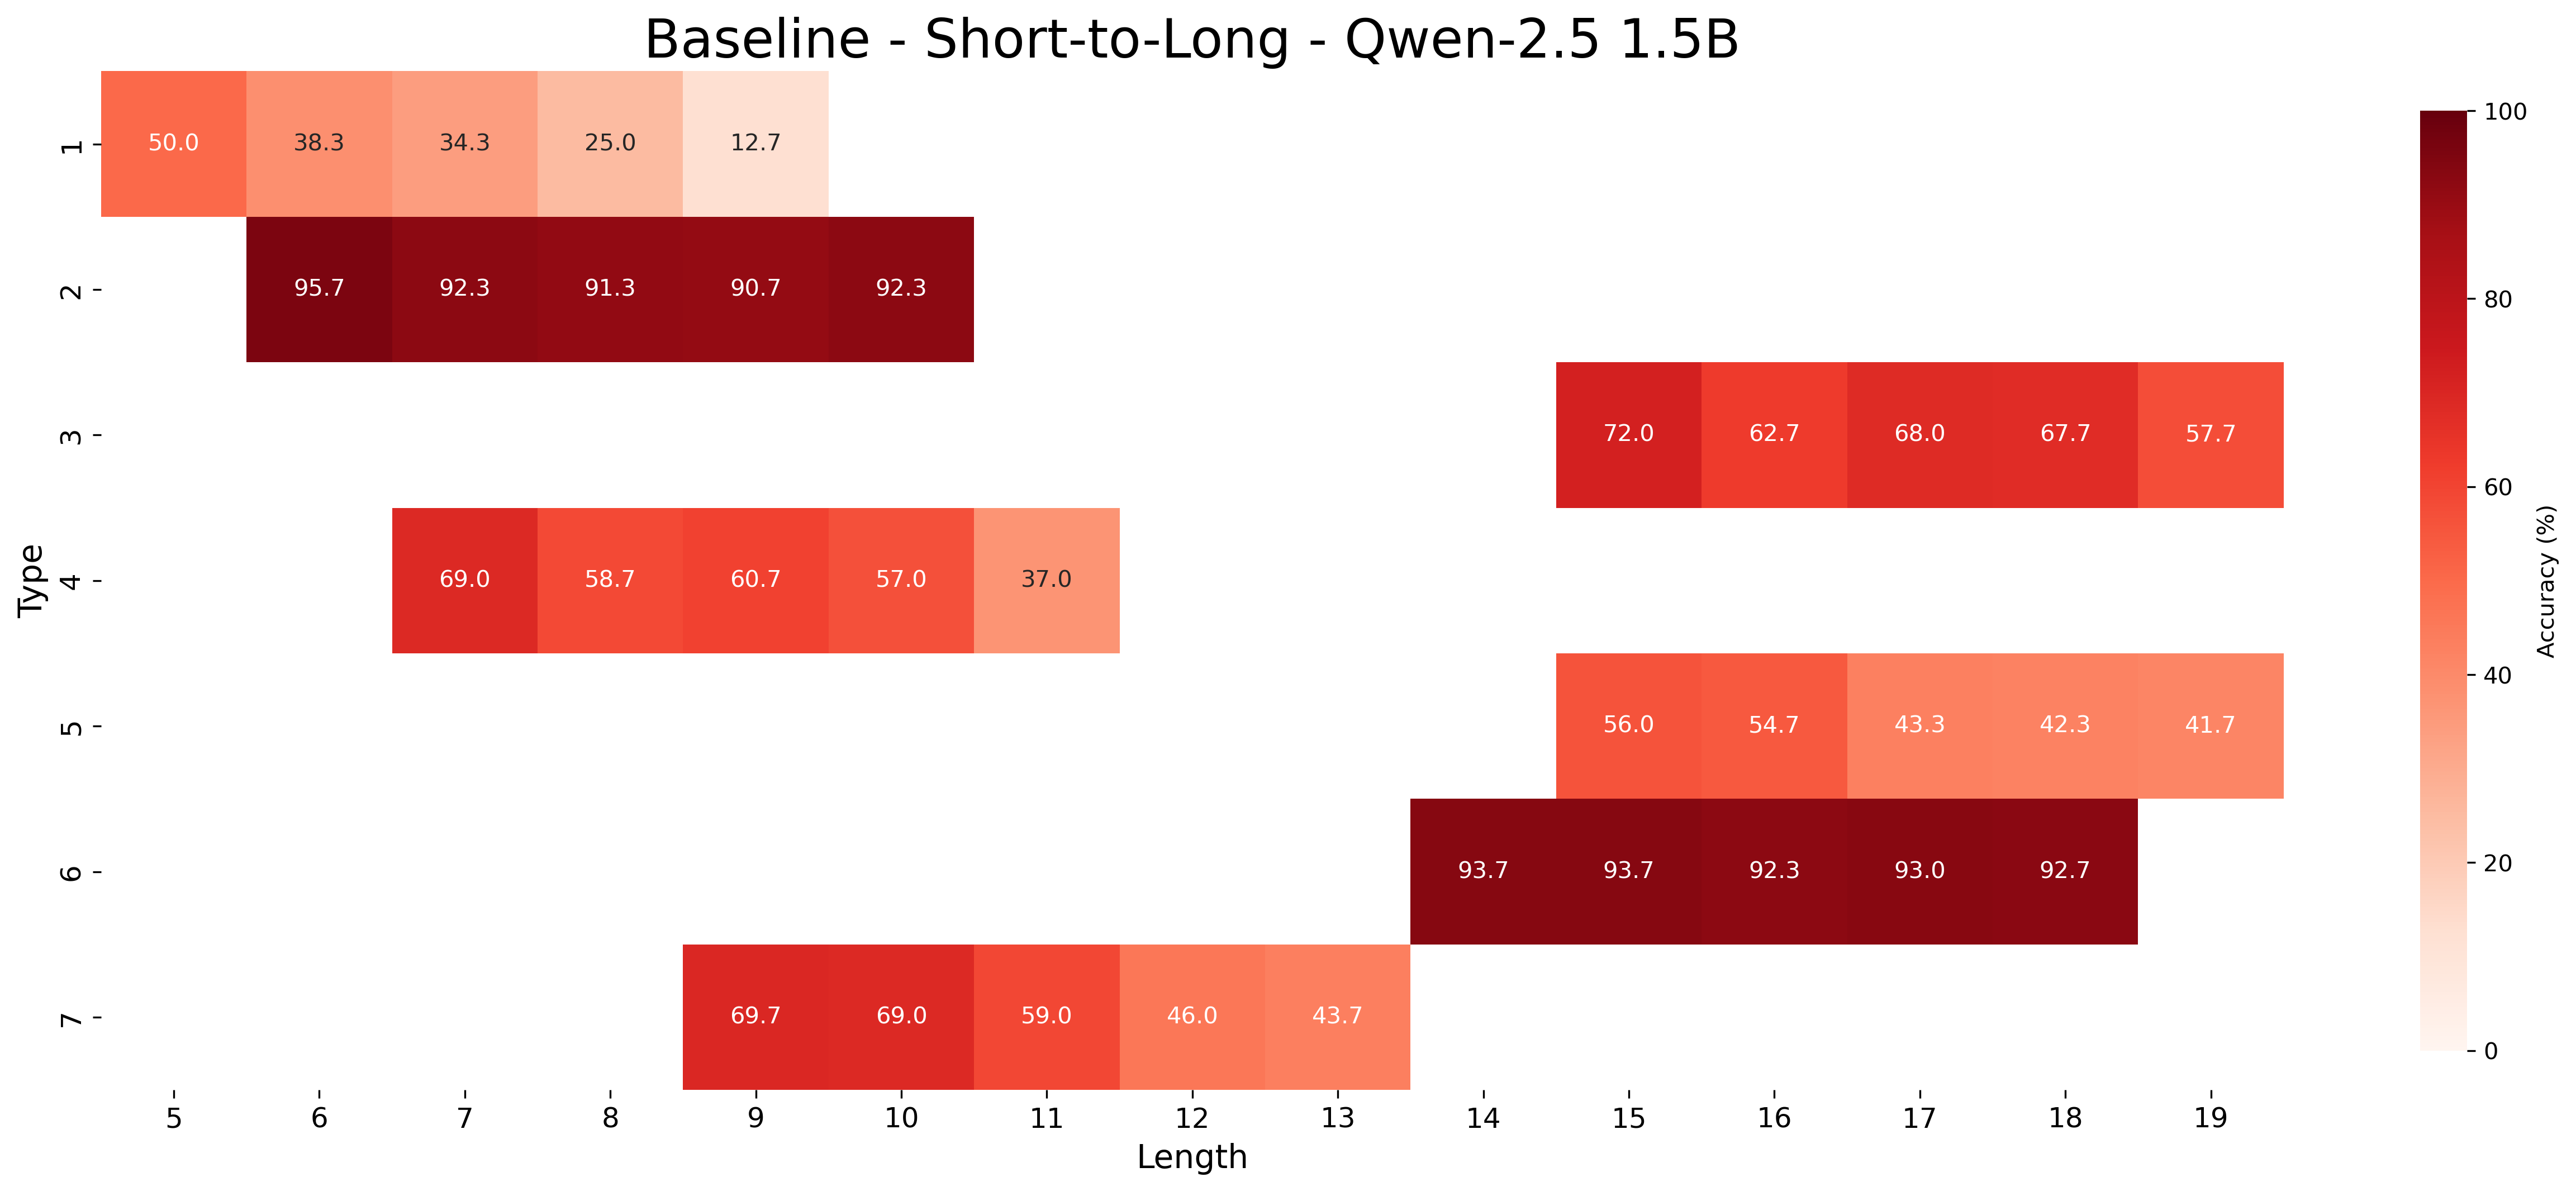
The image is a heatmap displaying accuracy percentages for different "Types" across varying "Length" values. The heatmap uses a color gradient from white to dark red, where darker shades of red indicate higher accuracy. The "Type" is on the vertical axis, and "Length" is on the horizontal axis.
### Components/Axes
* **Title:** Baseline - Short-to-Long - Qwen-2.5 1.5B
* **X-axis:** Length, with values ranging from 5 to 19.
* **Y-axis:** Type, with values ranging from 1 to 7.
* **Color Bar (Right):** Accuracy (%), ranging from 0 to 100. The color gradient goes from white (0%) to dark red (100%).
### Detailed Analysis or ### Content Details
Here's a breakdown of the accuracy values for each Type and Length combination:
* **Type 1:**
* Length 5: 50.0%
* Length 6: 38.3%
* Length 7: 34.3%
* Length 8: 25.0%
* Length 9: 12.7%
* Trend: Accuracy decreases as Length increases.
* **Type 2:**
* Length 6: 95.7%
* Length 7: 92.3%
* Length 8: 91.3%
* Length 9: 90.7%
* Length 10: 92.3%
* Trend: Relatively stable, high accuracy across all lengths.
* **Type 3:**
* Length 14: 72.0%
* Length 15: 62.7%
* Length 16: 68.0%
* Length 17: 67.7%
* Length 18: 57.7%
* Trend: Accuracy fluctuates, with a slight decrease towards longer lengths.
* **Type 4:**
* Length 7: 69.0%
* Length 8: 58.7%
* Length 9: 60.7%
* Length 10: 57.0%
* Length 11: 37.0%
* Trend: Accuracy decreases as Length increases.
* **Type 5:**
* Length 14: 56.0%
* Length 15: 54.7%
* Length 16: 43.3%
* Length 17: 42.3%
* Length 18: 41.7%
* Trend: Accuracy decreases as Length increases.
* **Type 6:**
* Length 14: 93.7%
* Length 15: 93.7%
* Length 16: 92.3%
* Length 17: 93.0%
* Length 18: 92.7%
* Trend: Relatively stable, high accuracy across all lengths.
* **Type 7:**
* Length 9: 69.7%
* Length 10: 69.0%
* Length 11: 59.0%
* Length 12: 46.0%
* Length 13: 43.7%
* Trend: Accuracy decreases as Length increases.
### Key Observations
* Types 2 and 6 consistently show high accuracy across the tested lengths.
* Types 1, 4, 5, and 7 generally exhibit a decrease in accuracy as the length increases.
* Type 3 shows a fluctuating accuracy with a slight downward trend.
### Interpretation
The heatmap visualizes the performance of the "Qwen-2.5 1.5B" model under "Baseline - Short-to-Long" conditions. The data suggests that the model's accuracy is highly dependent on the "Type" and "Length" of the input. Types 2 and 6 appear to be more robust to changes in length, maintaining high accuracy. In contrast, Types 1, 4, 5, and 7 show a decline in performance as the input length increases, indicating potential limitations in handling longer sequences for these types. Type 3's fluctuating accuracy might suggest sensitivity to specific patterns or features within the input data. The model's overall performance varies significantly across different types, highlighting the importance of considering input characteristics when evaluating its effectiveness.