## Heatmap: Baseline - Short-to-Long - Qwen-2.5 1.5B
### Overview
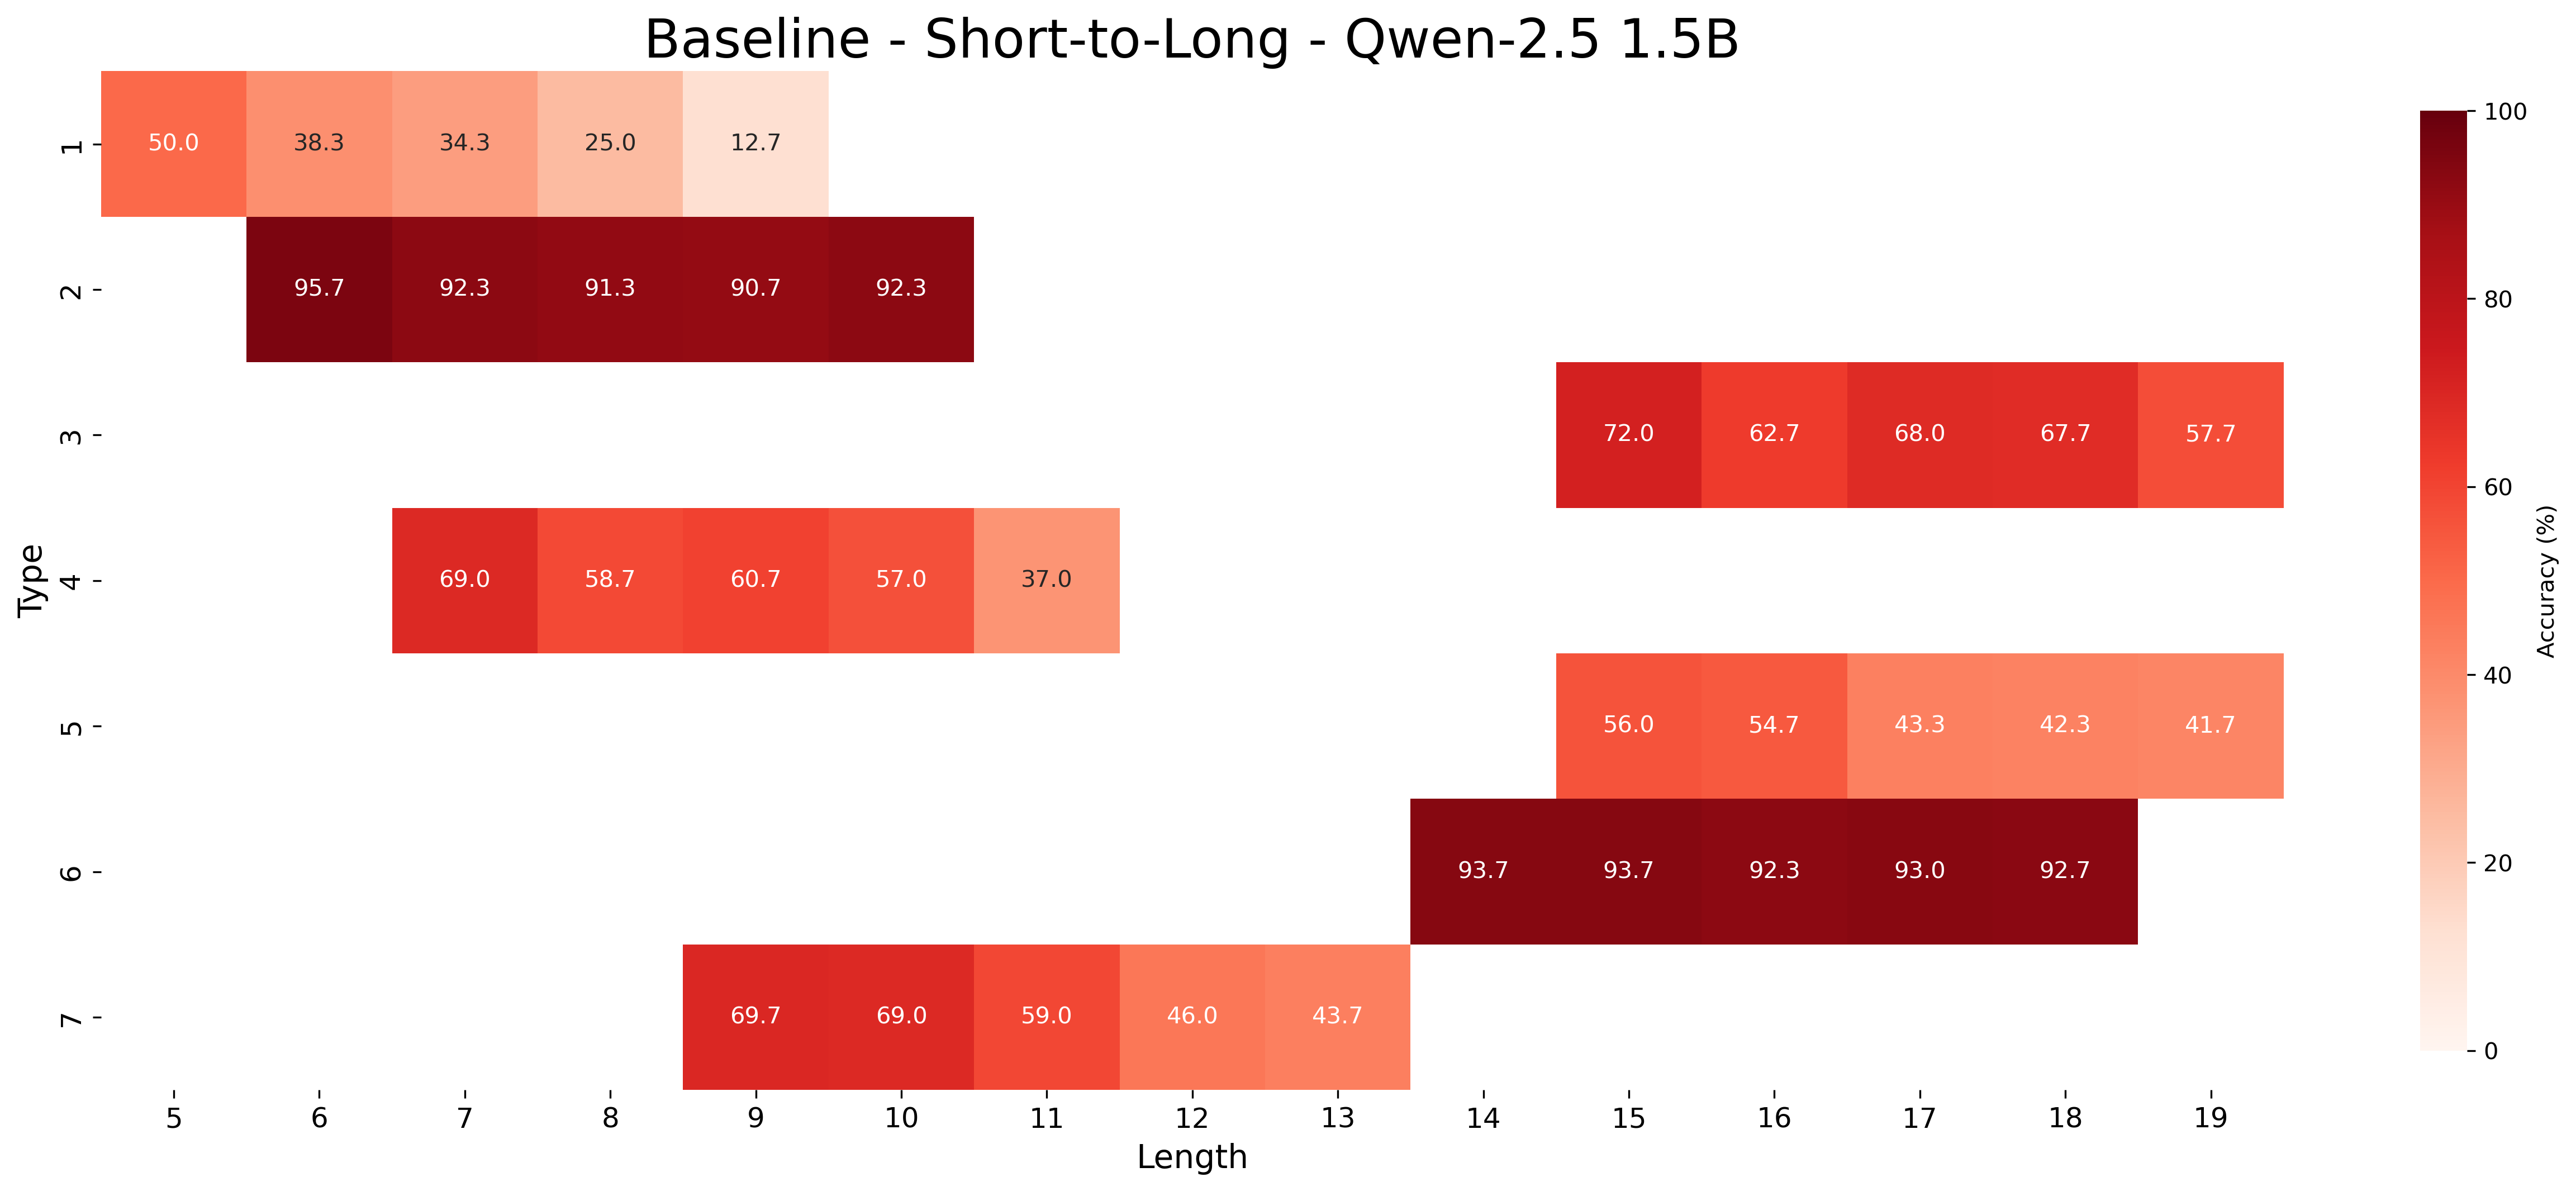
This heatmap visualizes the accuracy of a model (Qwen-2.5 1.5B) across different input lengths and types. The color intensity represents the accuracy percentage, with darker shades indicating higher accuracy. The heatmap is structured with 'Length' on the x-axis and 'Type' on the y-axis.
### Components/Axes
* **Title:** Baseline - Short-to-Long - Qwen-2.5 1.5B (Top-center)
* **X-axis Label:** Length (Bottom-center)
* **X-axis Markers:** 5, 6, 7, 8, 9, 10, 11, 12, 13, 14, 15, 16, 17, 18, 19
* **Y-axis Label:** Type (Left-center)
* **Y-axis Markers:** 1, 2, 3, 4, 5, 6, 7
* **Color Scale:** A gradient scale on the right indicates accuracy percentage, ranging from 0% (lightest color) to 100% (darkest color).
* **Legend:** The color scale acts as the legend, mapping color intensity to accuracy values.
### Detailed Analysis
The heatmap displays accuracy values for each combination of 'Type' and 'Length'. Here's a breakdown of the data:
* **Type 1:**
* Length 5: 50.0%
* Length 6: 38.3%
* Length 7: 34.3%
* Length 8: 25.0%
* Length 9: 12.7%
* **Type 2:**
* Length 5: 95.7%
* Length 6: 92.3%
* Length 7: 91.3%
* Length 8: 90.7%
* Length 9: 92.3%
* **Type 3:**
* Length 14: 72.0%
* Length 15: 62.0%
* Length 16: 68.0%
* Length 17: 67.7%
* Length 18: 57.7%
* **Type 4:**
* Length 5: 69.0%
* Length 6: 58.7%
* Length 7: 60.7%
* Length 8: 57.0%
* Length 9: 37.0%
* **Type 5:**
* Length 14: 56.0%
* Length 15: 54.0%
* Length 16: 43.3%
* Length 17: 42.3%
* Length 18: 41.7%
* **Type 6:**
* Length 14: 93.7%
* Length 15: 92.7%
* Length 16: 93.0%
* Length 17: 93.0%
* Length 18: 92.7%
* **Type 7:**
* Length 9: 69.7%
* Length 10: 69.0%
* Length 11: 59.0%
* Length 12: 46.0%
* Length 13: 43.7%
**Trends:**
* For Type 1, accuracy decreases significantly as length increases.
* Type 2 consistently exhibits high accuracy across all lengths.
* Type 3 shows a decreasing trend in accuracy as length increases.
* Type 4 shows a decreasing trend in accuracy as length increases.
* Type 5 shows a decreasing trend in accuracy as length increases.
* Type 6 consistently exhibits high accuracy across all lengths.
* Type 7 shows a decreasing trend in accuracy as length increases.
### Key Observations
* Type 2 and Type 6 consistently demonstrate the highest accuracy values (above 90%) across all lengths.
* Type 1 exhibits the lowest accuracy, particularly at longer lengths.
* Accuracy generally tends to decrease as the input length increases for most types.
* There is a clear separation in accuracy performance between different types.
### Interpretation
The heatmap suggests that the Qwen-2.5 1.5B model performs significantly better on Types 2 and 6, regardless of input length. Conversely, it struggles with Type 1, especially as the input length increases. The decreasing accuracy trend with increasing length for most types indicates a potential limitation in the model's ability to handle longer sequences effectively. This could be due to factors like vanishing gradients or limitations in the model's attention mechanism. The data highlights the importance of considering both input length and type when evaluating the model's performance and suggests that further optimization may be needed to improve its handling of longer sequences and specific input types (like Type 1). The heatmap provides a concise visual representation of the model's strengths and weaknesses, enabling targeted improvements and informed decision-making.