TECHNICAL ASSET FINGERPRINT
e3146f22fc67d2b4fd49b863
Click to view fullscreen
Press ESC or click to close
FOUND IN PAPERS
EXPERT: healer-alpha-free VERSION 1
RUNTIME: free/openrouter/healer-alpha
INTEL_VERIFIED
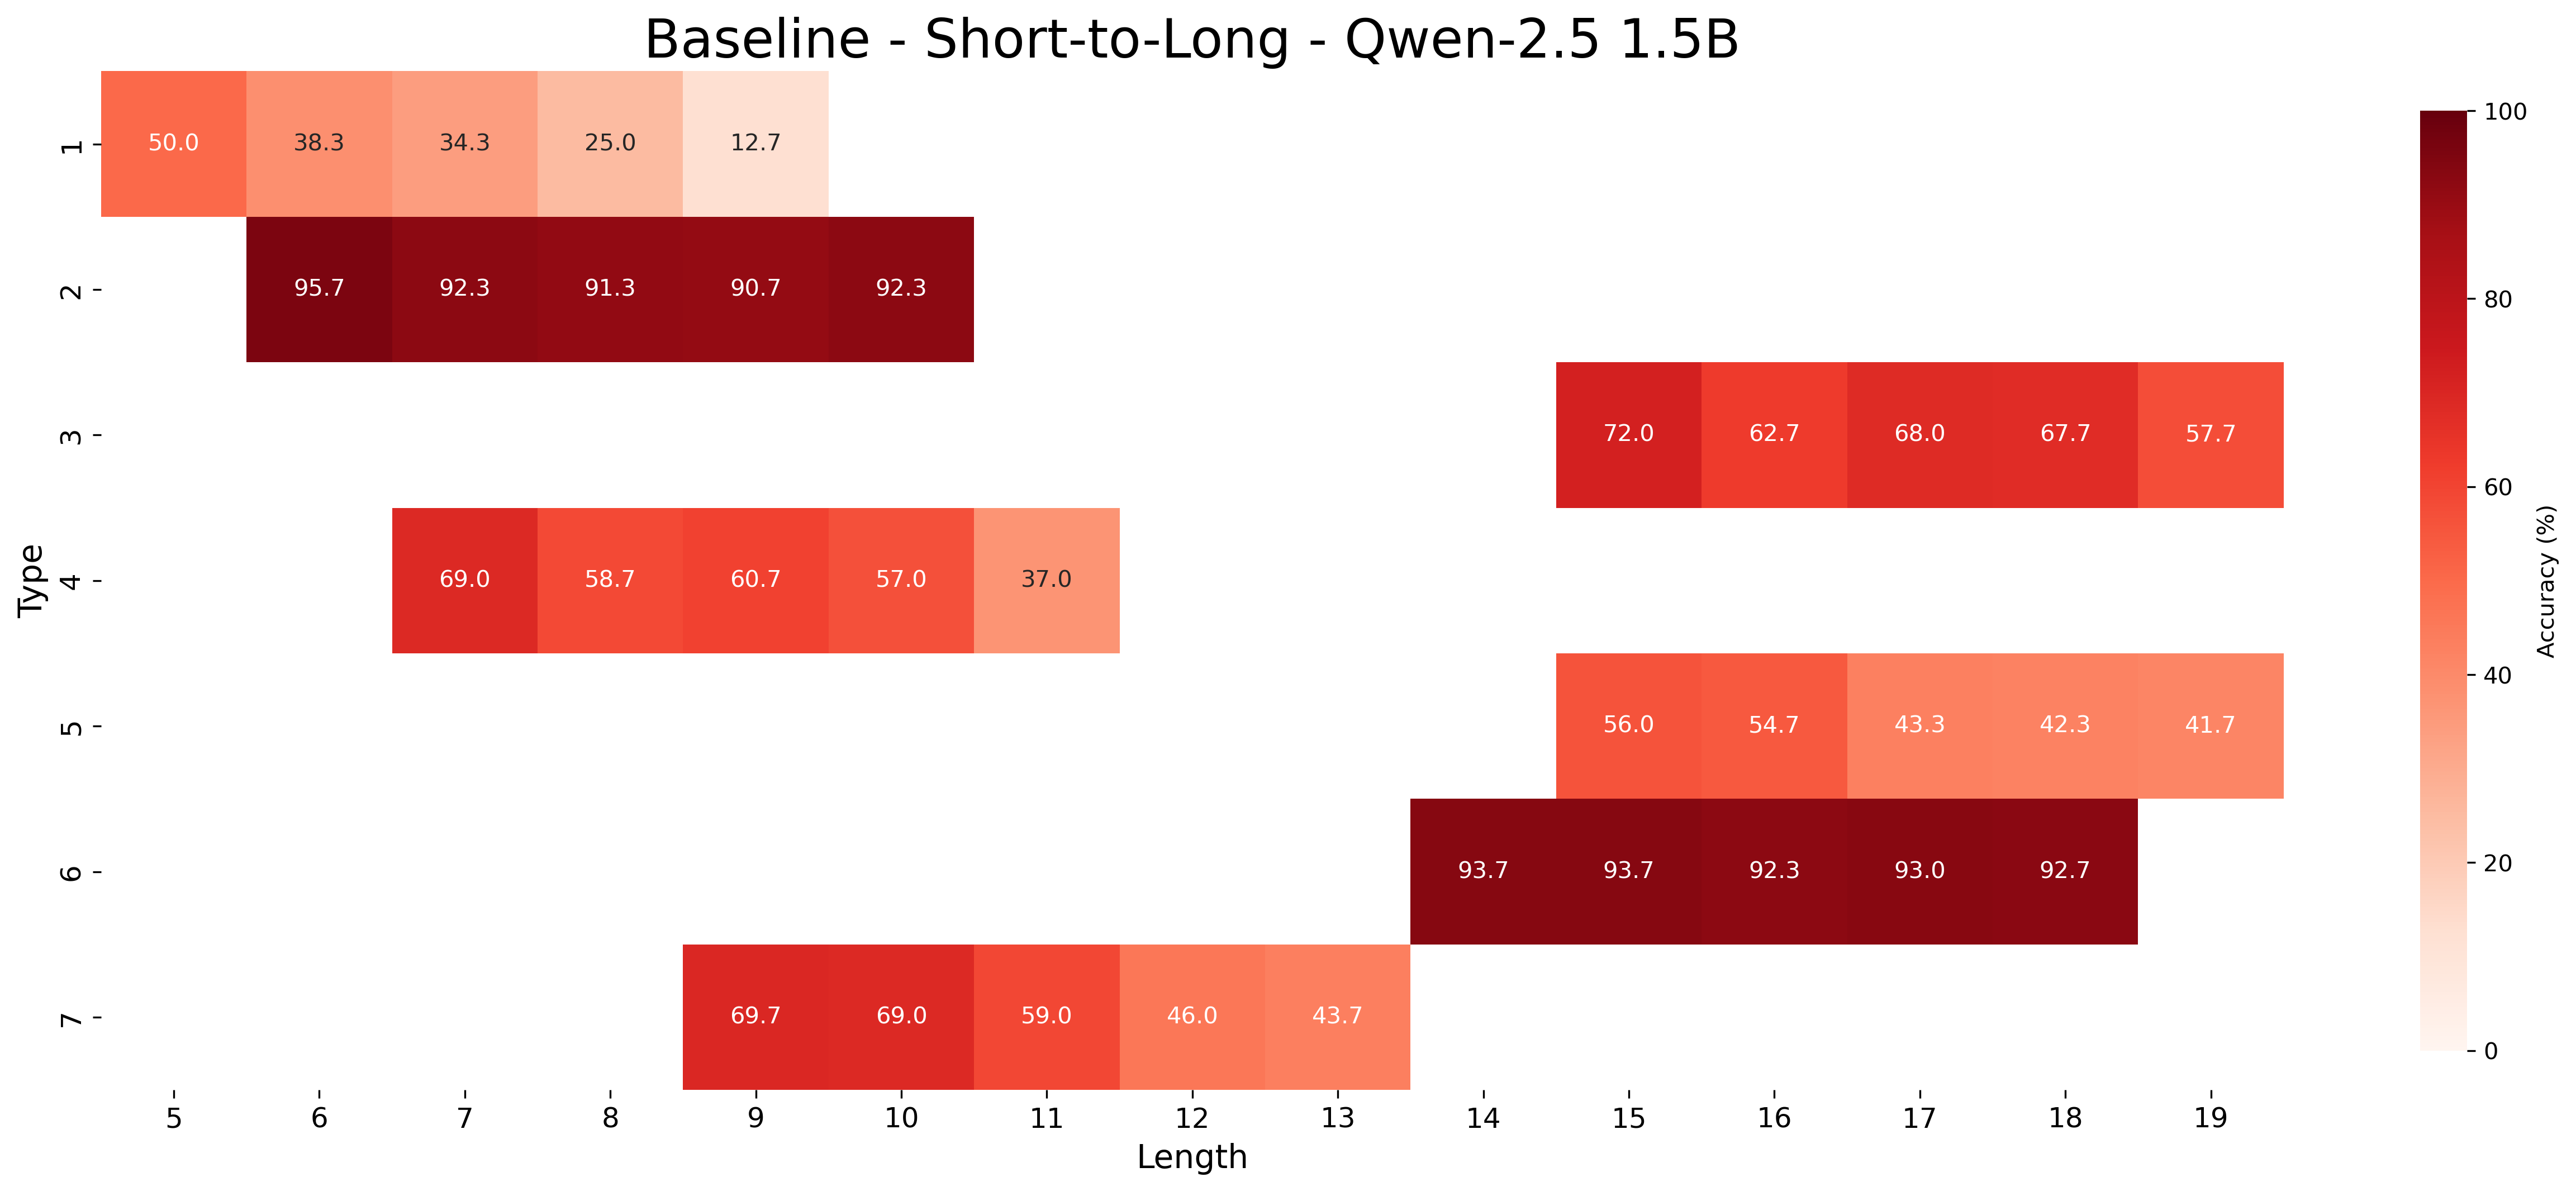
## Heatmap: Baseline - Short-to-Long - Qwen-2.5 1.5B
### Overview
This image is a heatmap visualizing the accuracy performance of a model named "Qwen-2.5 1.5B" across different task "Types" and input sequence "Lengths." The chart is titled "Baseline - Short-to-Long - Qwen-2.5 1.5B," suggesting it evaluates the model's baseline performance when handling sequences that vary from short to long. The data is presented as a grid where each cell's color and numerical value represent the accuracy percentage for a specific Type-Length combination.
### Components/Axes
* **Title:** "Baseline - Short-to-Long - Qwen-2.5 1.5B" (Top center).
* **Y-Axis (Vertical):** Labeled **"Type"**. It lists 7 discrete categories, numbered 1 through 7 from top to bottom.
* **X-Axis (Horizontal):** Labeled **"Length"**. It represents a numerical scale from 5 to 19, with tick marks at each integer.
* **Color Bar/Legend:** Located on the right side of the chart. It is a vertical gradient bar labeled **"Accuracy (%)"**. The scale runs from 0 (lightest, near-white) to 100 (darkest, deep red). Key markers are at 0, 20, 40, 60, 80, and 100.
* **Data Cells:** The main chart area contains colored rectangular cells. Each cell contains a white numerical value representing the accuracy percentage. The cell's color corresponds to the value according to the color bar. Not all Type-Length intersections contain data; many cells are empty (white background).
### Detailed Analysis
The following table reconstructs the data from the heatmap. An empty cell indicates no data was recorded for that Type-Length combination.
| Type | Length 5 | Length 6 | Length 7 | Length 8 | Length 9 | Length 10 | Length 11 | Length 12 | Length 13 | Length 14 | Length 15 | Length 16 | Length 17 | Length 18 | Length 19 |
| :--- | :--- | :--- | :--- | :--- | :--- | :--- | :--- | :--- | :--- | :--- | :--- | :--- | :--- | :--- | :--- |
| **1** | 50.0 | 38.3 | 34.3 | 25.0 | 12.7 | | | | | | | | | | |
| **2** | | 95.7 | 92.3 | 91.3 | 90.7 | 92.3 | | | | | | | | | |
| **3** | | | | | | | | | | | 72.0 | 62.7 | 68.0 | 67.7 | 57.7 |
| **4** | | | 69.0 | 58.7 | 60.7 | 57.0 | 37.0 | | | | | | | | |
| **5** | | | | | | | | | | | 56.0 | 54.7 | 43.3 | 42.3 | 41.7 |
| **6** | | | | | | | | | | 93.7 | 93.7 | 92.3 | 93.0 | 92.7 | |
| **7** | | | | | 69.7 | 69.0 | 59.0 | 46.0 | 43.7 | | | | | | |
**Trend Verification by Type:**
* **Type 1 (Lengths 5-9):** The line of data slopes sharply downward. Accuracy decreases monotonically from 50.0% to 12.7% as length increases.
* **Type 2 (Lengths 6-10):** The data shows consistently high accuracy with minimal variation. Values remain above 90%, indicating robust performance across this length range.
* **Type 3 (Lengths 15-19):** The trend is generally downward but with fluctuation. It starts at 72.0%, dips to 62.7%, recovers to 68.0%, then declines to 57.7%.
* **Type 4 (Lengths 7-11):** The trend is downward. Accuracy falls from 69.0% to a low of 37.0% at the longest length in its range.
* **Type 5 (Lengths 15-19):** The trend is a steady, monotonic decline from 56.0% to 41.7%.
* **Type 6 (Lengths 14-18):** The data shows exceptionally high and stable accuracy, with all values between 92.3% and 93.7%. There is no significant downward trend.
* **Type 7 (Lengths 9-13):** The trend is a clear, monotonic decline from 69.7% to 43.7%.
### Key Observations
1. **Performance Clusters:** The model's performance falls into distinct clusters:
* **High & Stable:** Types 2 and 6 maintain accuracy above 90% across their tested lengths.
* **Moderate & Declining:** Types 3, 4, 5, and 7 show moderate starting accuracy (56-72%) that degrades significantly with increased length.
* **Poor & Rapidly Declining:** Type 1 starts at only 50% and drops to near 10%.
2. **Length Sensitivity:** For most Types (1, 3, 4, 5, 7), accuracy is inversely correlated with sequence length. The model struggles more as inputs get longer.
3. **Data Gaps:** The heatmap is sparse. Each Type is only evaluated over a specific, non-overlapping range of lengths (e.g., Type 1 only for short lengths 5-9, Type 3 only for long lengths 15-19). This suggests the "Types" may represent different task categories or data distributions that are inherently associated with different typical lengths.
4. **Color-Value Consistency:** The color intensity accurately reflects the numerical values. The darkest red cells (Type 2, Type 6) correspond to the highest accuracies (>90%), while the lightest cells (Type 1 at Length 9) correspond to the lowest accuracy (12.7%).
### Interpretation
This heatmap provides a diagnostic view of the Qwen-2.5 1.5B model's capabilities and limitations in a "short-to-long" context.
* **What the data suggests:** The model exhibits highly variable performance depending on the task "Type." It is exceptionally robust and accurate for certain tasks (Types 2 and 6), regardless of sequence length within the tested range. However, for other tasks (Types 1, 3, 4, 5, 7), its performance degrades as sequences become longer. This indicates a potential weakness in maintaining context or coherence over extended sequences for specific types of problems.
* **How elements relate:** The "Type" axis is the primary differentiator of performance. The "Length" axis acts as a stress test, revealing the model's stability. The stark contrast between the stable high performance of Types 2/6 and the declining performance of others suggests fundamental differences in how the model processes these task categories. The sparse, non-overlapping length ranges for each Type imply that the evaluation was designed to test each Type within its natural or challenging length regime.
* **Notable anomalies:** The slight accuracy increase for Type 3 from Length 16 (62.7%) to Length 17 (68.0%) is an outlier in the general downward trend, which could be due to statistical noise or a specific characteristic of the test samples at that length.
* **Why it matters:** This analysis is crucial for understanding the model's reliability. Users or developers would know to expect consistent, high-quality outputs for tasks resembling Types 2 and 6, but would need to be cautious or apply additional techniques (like chunking or fine-tuning) when using the model for tasks similar to Types 1, 4, or 7, especially with long inputs. The chart effectively maps the model's "comfort zone" across the task-length spectrum.
DECODING INTELLIGENCE...