# Technical Document Extraction: Heatmap Analysis
## Image Description
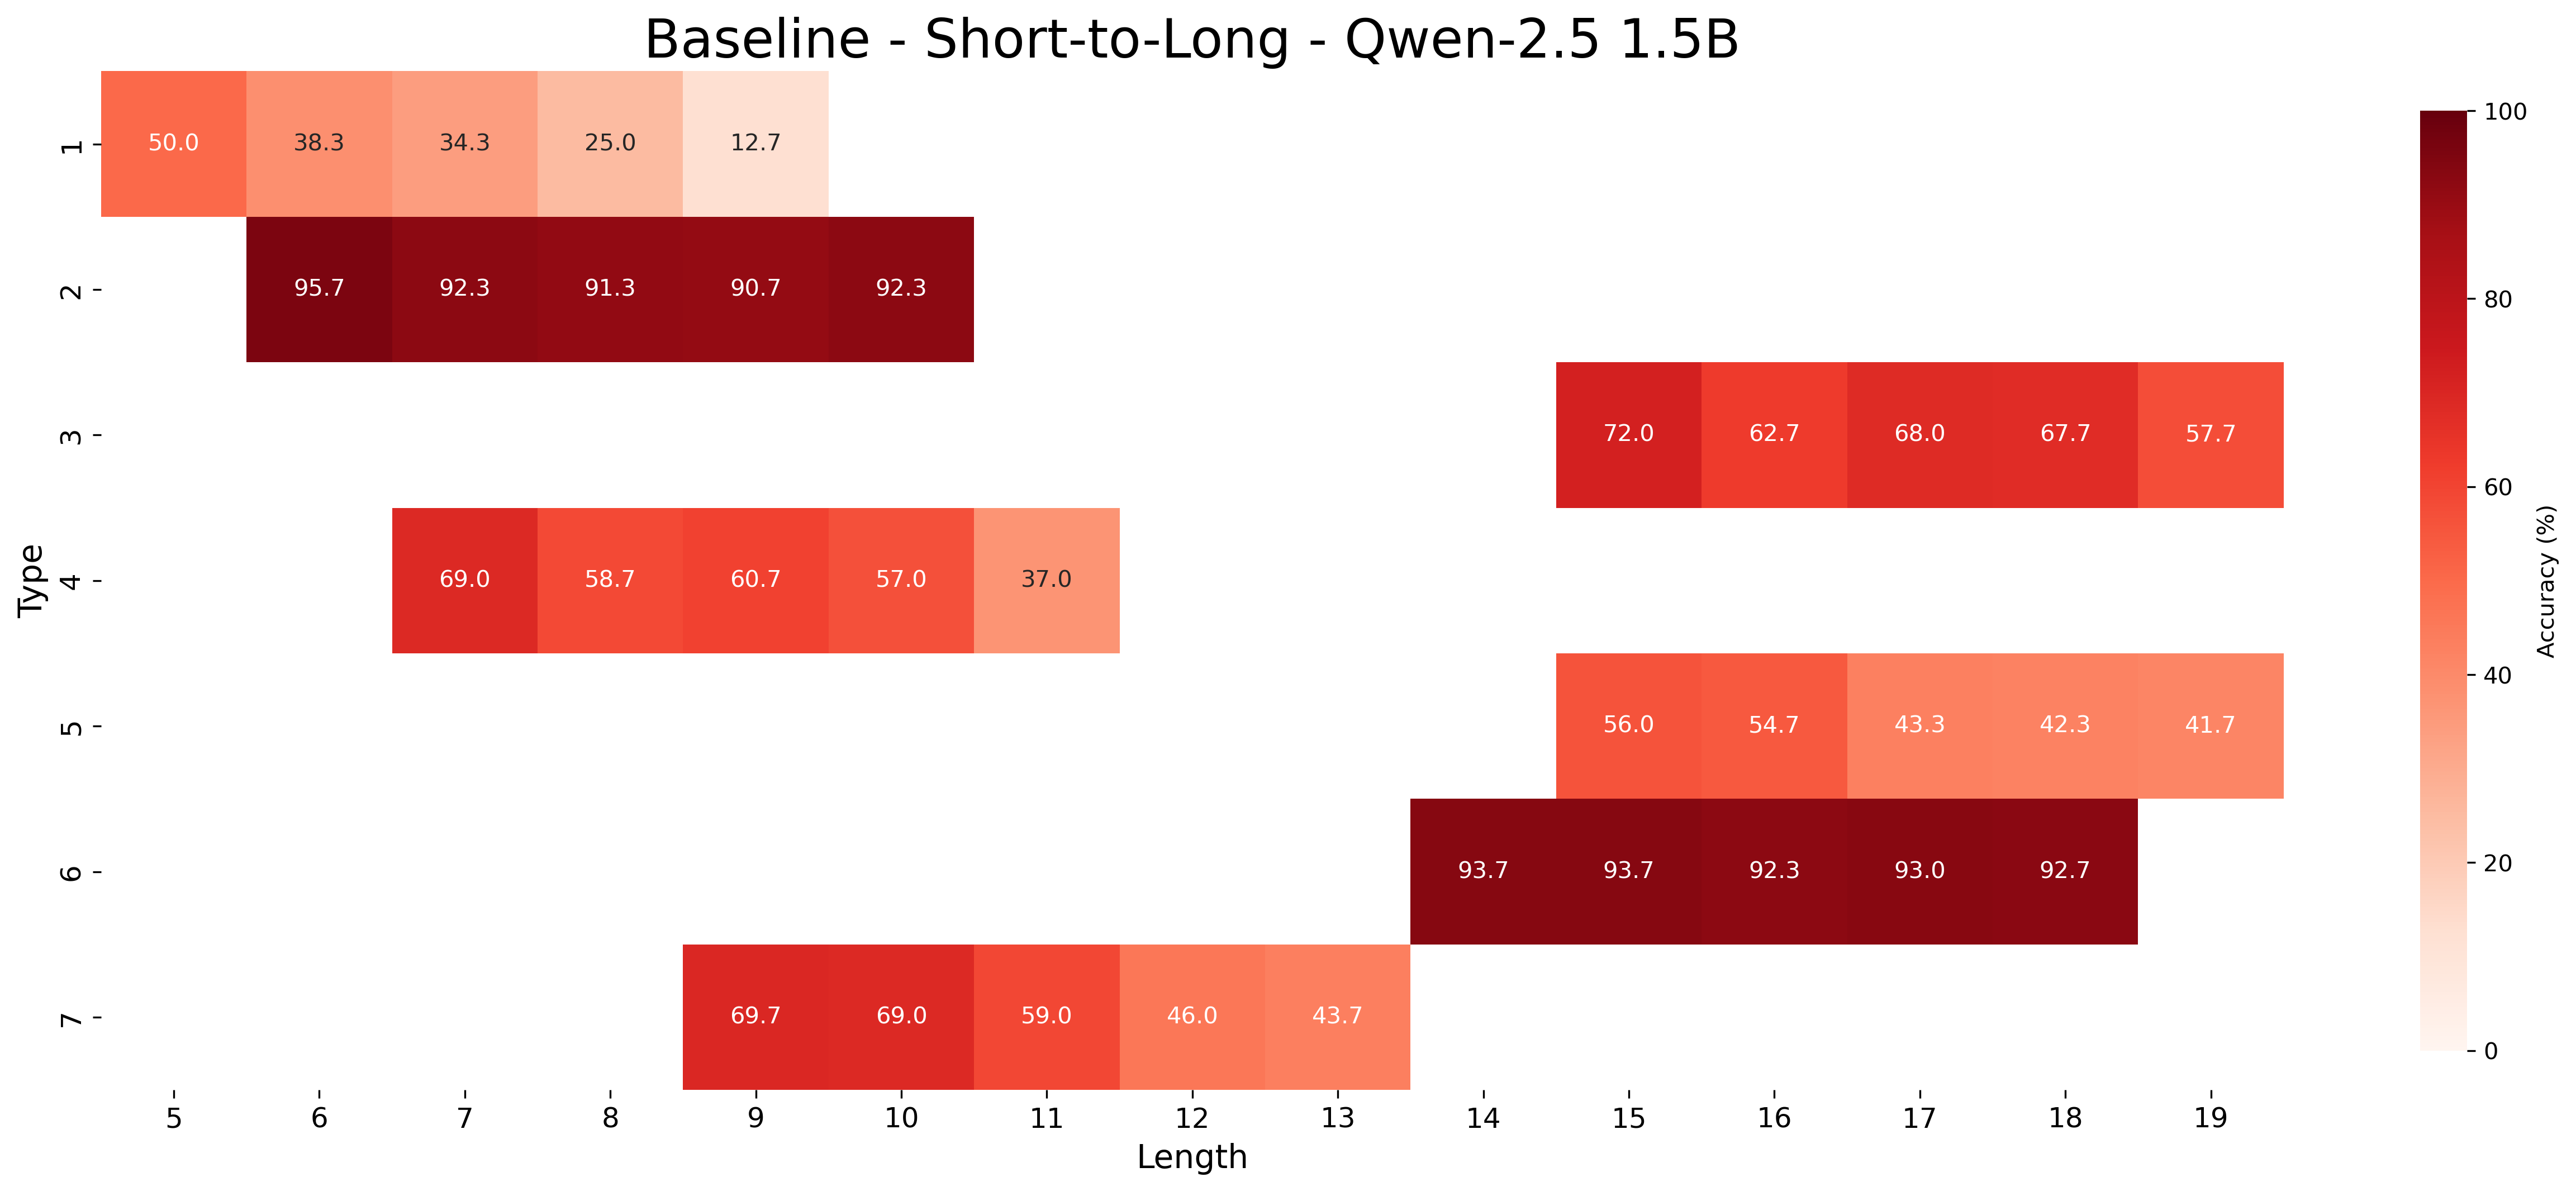
The image is a **heatmap** titled **"Baseline - Short-to-Long - Qwen-2.5 1.5B"**, visualizing accuracy percentages across two dimensions: **Type** (y-axis) and **Length** (x-axis). The color gradient ranges from light orange (low accuracy) to dark red (high accuracy), with a colorbar legend on the right.
---
### Key Components
1. **Title**:
`Baseline - Short-to-Long - Qwen-2.5 1.5B`
2. **Axes**:
- **X-axis (Length)**:
Labels: `5, 6, 7, 8, 9, 10, 11, 12, 13, 14, 15, 16, 17, 18, 19`
Title: `Length`
- **Y-axis (Type)**:
Labels: `1, 2, 3, 4, 5, 6, 7`
Title: `Type`
3. **Legend**:
- **Colorbar**:
- Title: `Accuracy (%)`
- Range: `0%` (light orange) to `100%` (dark red)
- Spatial Grounding: Right-aligned, adjacent to the heatmap.
---
### Data Structure
The heatmap represents a **7x15 grid** (7 types × 15 lengths). Each cell contains an accuracy percentage. Below is the reconstructed table:
| Type \ Length | 5 | 6 | 7 | 8 | 9 | 10 | 11 | 12 | 13 | 14 | 15 | 16 | 17 | 18 | 19 |
|---------------|------|------|------|------|------|------|------|------|------|------|------|------|------|------|------|
| 1 | 50.0 | 38.3 | 34.3 | 25.0 | 12.7 | | | | | | | | | | |
| 2 | | 95.7 | 92.3 | 91.3 | 90.7 | 92.3 | | | | | | | | | |
| 3 | | | | | | | | | | | 72.0 | 62.7 | 68.0 | 67.7 | 57.7 |
| 4 | | | 69.0 | 58.7 | 60.7 | 57.0 | 37.0 | | | | | | | | |
| 5 | | | | | | | | | | | 56.0 | 54.7 | 43.3 | 42.3 | 41.7 |
| 6 | | | | | | | | | | | 93.7 | 93.7 | 92.3 | 93.0 | 92.7 |
| 7 | | | | | 69.7 | 69.0 | 59.0 | 46.0 | 43.7 | | | | | | |
---
### Trends and Observations
1. **General Pattern**:
- Accuracy **decreases** as `Length` increases for most types (e.g., Type 1: 50.0 → 12.7).
- Exceptions:
- **Type 6** maintains high accuracy (93.7–92.7) across lengths 15–19.
- **Type 2** shows a slight dip at Length 10 (90.7) but recovers to 92.3 at Length 19.
2. **Specific Trends**:
- **Type 1**: Steep decline from 50.0 (Length 5) to 12.7 (Length 19).
- **Type 3**: Gradual decline from 72.0 (Length 15) to 57.7 (Length 19).
- **Type 4**: Moderate decline from 69.0 (Length 7) to 37.0 (Length 12).
- **Type 5**: Steady decline from 56.0 (Length 15) to 41.7 (Length 19).
- **Type 7**: Decline from 69.7 (Length 9) to 43.7 (Length 13).
3. **Color Consistency**:
- Darker red cells (e.g., Type 2, Length 6: 95.7) align with the legend’s high-accuracy range.
- Lighter orange cells (e.g., Type 1, Length 19: 12.7) match the legend’s low-accuracy range.
---
### Spatial Grounding
- **Legend Position**: Right side of the heatmap.
- **Data Point Verification**:
- Example: Type 6, Length 15 (93.7%) is dark red, matching the legend’s high-accuracy range.
- Example: Type 1, Length 19 (12.7%) is light orange, matching the legend’s low-accuracy range.
---
### Conclusion
The heatmap illustrates a clear inverse relationship between `Length` and `Accuracy` for most types, with **Type 6** being an outlier due to consistently high performance. The colorbar legend effectively maps accuracy percentages to visual intensity.