## Scatter Plot: Energy Consumption vs. Date for Different Token Sizes
### Overview
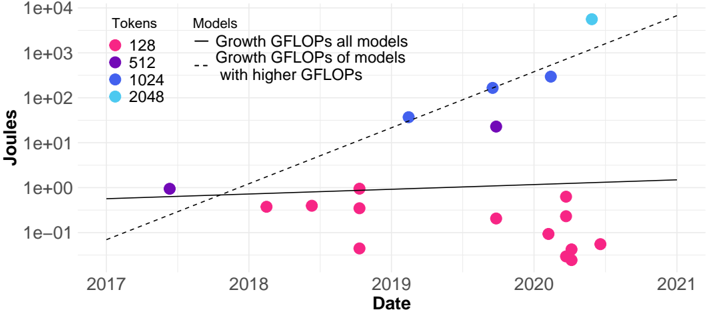
The image is a scatter plot showing the relationship between energy consumption (Joules) and date for different token sizes. The plot includes data points for token sizes of 128, 512, 1024, and 2048. Trend lines indicate the growth of GFLOPs (Giga Floating Point Operations per Second) for all models and for models with higher GFLOPs.
### Components/Axes
* **X-axis:** Date, ranging from 2017 to 2021.
* **Y-axis:** Joules, ranging from 1e-01 (0.1) to 1e+04 (10,000) on a logarithmic scale.
* **Legend (Top-Left):**
* **Tokens:**
* Pink: 128
* Purple: 512
* Blue: 1024
* Light Blue: 2048
* **Models:**
* Solid Black Line: Growth GFLOPs all models
* Dashed Black Line: Growth GFLOPs of models with higher GFLOPs
### Detailed Analysis
* **Token Size 128 (Pink):**
* Data points are clustered around the 2020 mark, with energy consumption values ranging approximately from 0.05 to 1 Joule.
* There is a single data point around 2018 with a value of approximately 0.5 Joules.
* **Token Size 512 (Purple):**
* One data point in 2017 at approximately 1 Joule.
* One data point in 2019 at approximately 20 Joules.
* **Token Size 1024 (Blue):**
* One data point in 2019 at approximately 100 Joules.
* One data point in 2020 at approximately 200 Joules.
* **Token Size 2048 (Light Blue):**
* One data point in 2020 at approximately 8000 Joules.
* **Growth GFLOPs all models (Solid Black Line):**
* The line is nearly horizontal, indicating a very slight increase in GFLOPs over time.
* The line starts at approximately 0.7 Joules in 2017 and ends at approximately 1.2 Joules in 2021.
* **Growth GFLOPs of models with higher GFLOPs (Dashed Black Line):**
* The line slopes upward, indicating an increase in GFLOPs over time.
* The line starts at approximately 0.01 Joules in 2017 and ends at approximately 1000 Joules in 2021.
### Key Observations
* Energy consumption generally increases with token size.
* The energy consumption for smaller token sizes (128) is relatively stable over time.
* The energy consumption for larger token sizes (1024, 2048) shows a significant increase in later years (2020).
* The growth of GFLOPs for all models is relatively flat, while the growth of GFLOPs for models with higher GFLOPs shows a significant increase over time.
### Interpretation
The data suggests that as token sizes increase, the energy consumption also increases, particularly in recent years. The flat growth of GFLOPs for all models indicates that the average computational efficiency has not improved significantly over time. However, the increasing GFLOPs for models with higher GFLOPs suggests that there is a trend towards more computationally intensive models, which consume more energy. The clustering of 128 token data points around 2020 suggests that these models were more prevalent during that period. The single data points for larger token sizes indicate that these models were less common but had significantly higher energy consumption.