## Line Chart: Growth in GFLOPs vs. Joules Over Time
### Overview
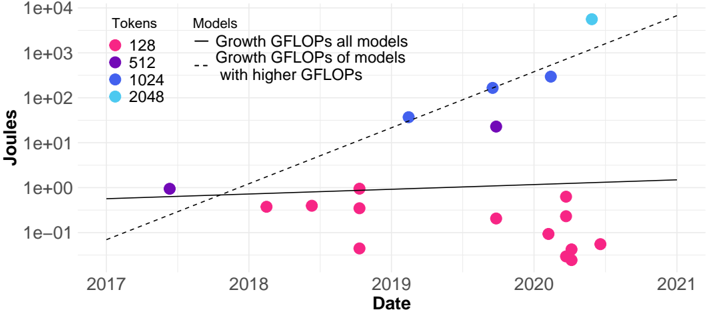
The chart illustrates the relationship between computational growth (measured in GFLOPs) and energy consumption (measured in Joules) for AI models over time, from 2017 to 2021. Two trend lines and scattered data points represent different model configurations.
### Components/Axes
- **X-axis (Date)**: Spans 2017 to 2021, with annual increments.
- **Y-axis (Joules)**: Logarithmic scale ranging from 1e-01 to 1e+04.
- **Legend**: Located in the top-left corner, with four color-coded categories:
- Pink: 128 tokens
- Purple: 512 tokens
- Blue: 1024 tokens
- Cyan: 2048 tokens
- **Lines**:
- Solid black: "Growth GFLOPs all models"
- Dashed black: "Growth GFLOPs of models with higher GFLOPs"
### Detailed Analysis
- **Solid Black Line (All Models)**:
- Starts near 1e+00 Joules in 2017.
- Gradually increases to ~1e+01 Joules by 2021.
- Represents the average growth trajectory across all models.
- **Dashed Black Line (Higher GFLOPs Models)**:
- Begins near 1e+01 Joules in 2017.
- Rises sharply to ~1e+04 Joules by 2021.
- Indicates faster growth for models with higher GFLOPs.
- **Data Points**:
- **Pink (128 tokens)**: Clustered below the solid line, mostly between 1e-01 and 1e+00 Joules (2018–2021).
- **Purple (512 tokens)**: Two points near the solid line (~1e+00 Joules) in 2017–2018, one at ~1e+01 Joules in 2019.
- **Blue (1024 tokens)**: Follows the dashed line closely, with points at ~1e+02 (2019), ~1e+03 (2020), and ~1e+04 (2021).
- **Cyan (2048 tokens)**: Single point at ~1e+04 Joules in 2021, aligning with the dashed line.
### Key Observations
1. **Divergence in Growth Rates**: Models with higher token counts (blue/cyan) exhibit significantly faster GFLOPs growth compared to lower token models (pink/purple).
2. **Energy Consumption Correlation**: Higher GFLOPs growth correlates with exponentially greater energy use (Joules), especially for models with 1024+ tokens.
3. **Temporal Trends**: The steepest growth occurs post-2019, with the largest models (2048 tokens) dominating by 2021.
### Interpretation
The chart demonstrates that computational efficiency (GFLOPs) and energy consumption (Joules) are strongly linked, with larger models driving disproportionate increases in both metrics. The dashed line highlights that models optimized for higher GFLOPs (likely newer architectures) outpace older, smaller models in growth rate. This suggests a trend toward increasingly resource-intensive AI development, raising concerns about sustainability and accessibility. Outliers like the 2048-token model in 2021 indicate rapid advancements in model scale, potentially reflecting breakthroughs in hardware or algorithmic efficiency.