## 3D Tetrahedron Diagram: State Space Representation
### Overview
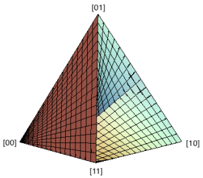
The image shows a 3D tetrahedron diagram, likely representing a state space. The vertices of the tetrahedron are labeled with binary states: [00], [01], [10], and [11]. The faces of the tetrahedron are colored with gradients, suggesting a continuous transition between the discrete states at the vertices.
### Components/Axes
* **Vertices:**
* [00] (bottom-left)
* [01] (top)
* [10] (bottom-right)
* [11] (bottom)
* **Faces:** The faces are colored with gradients, transitioning between the colors associated with the vertices. The colors are not explicitly defined, but they appear to range from dark red/brown to light blue/yellow.
### Detailed Analysis
The tetrahedron is oriented such that the [11] vertex is closest to the viewer, forming the base. The [00], [01], and [10] vertices are positioned around the top. The faces are rendered with a grid-like pattern, enhancing the 3D effect. The color gradients on each face suggest a continuous interpolation between the states represented by the vertices.
### Key Observations
* The diagram visually represents a state space where the vertices represent discrete states, and the faces represent continuous transitions between these states.
* The color gradients on the faces provide a visual cue for the relative "distance" or similarity between the states.
### Interpretation
The tetrahedron diagram is a visual tool for representing state spaces, particularly in systems with binary states. The vertices represent the fundamental states, while the faces represent the possible transitions or combinations of these states. The color gradients could represent probabilities, energy levels, or other continuous variables associated with the states. The diagram suggests a system where the states are interconnected and can transition smoothly between each other.